
Lake Louise Visitor Use Management – Data
Banff National Park
Amount of visitor use
Daily snapshot
- The Upper Lake Louise area saw approximately 11 000 daily visitors during the 2025 operating season, up from 9 000 daily visitors in 2023. However, accuracy of commercial use at Upper Lake Louise is limited to observations and estimates, so this number could vary.
- The Moraine Lake area saw approximately 6 000 daily visitors during the 2025 operational season, up from 5 000 daily visitors in 2023. This number is based on recorded averages throughout the season. It can fluctuate depending on the level of commercial use on any given day.
- While vehicle volumes in the area have been significantly reduced, more people than ever now visit daily, arriving to the lakes mainly by shuttles, public transit and commercial transportation operator.
- In 2025, we estimate that the Parks Canada shuttle transported 27% of all visitors to Upper Lake Louise, and 48% of all visitors to Moraine Lake. 87% of shuttle riders visited both lakes in the same day.
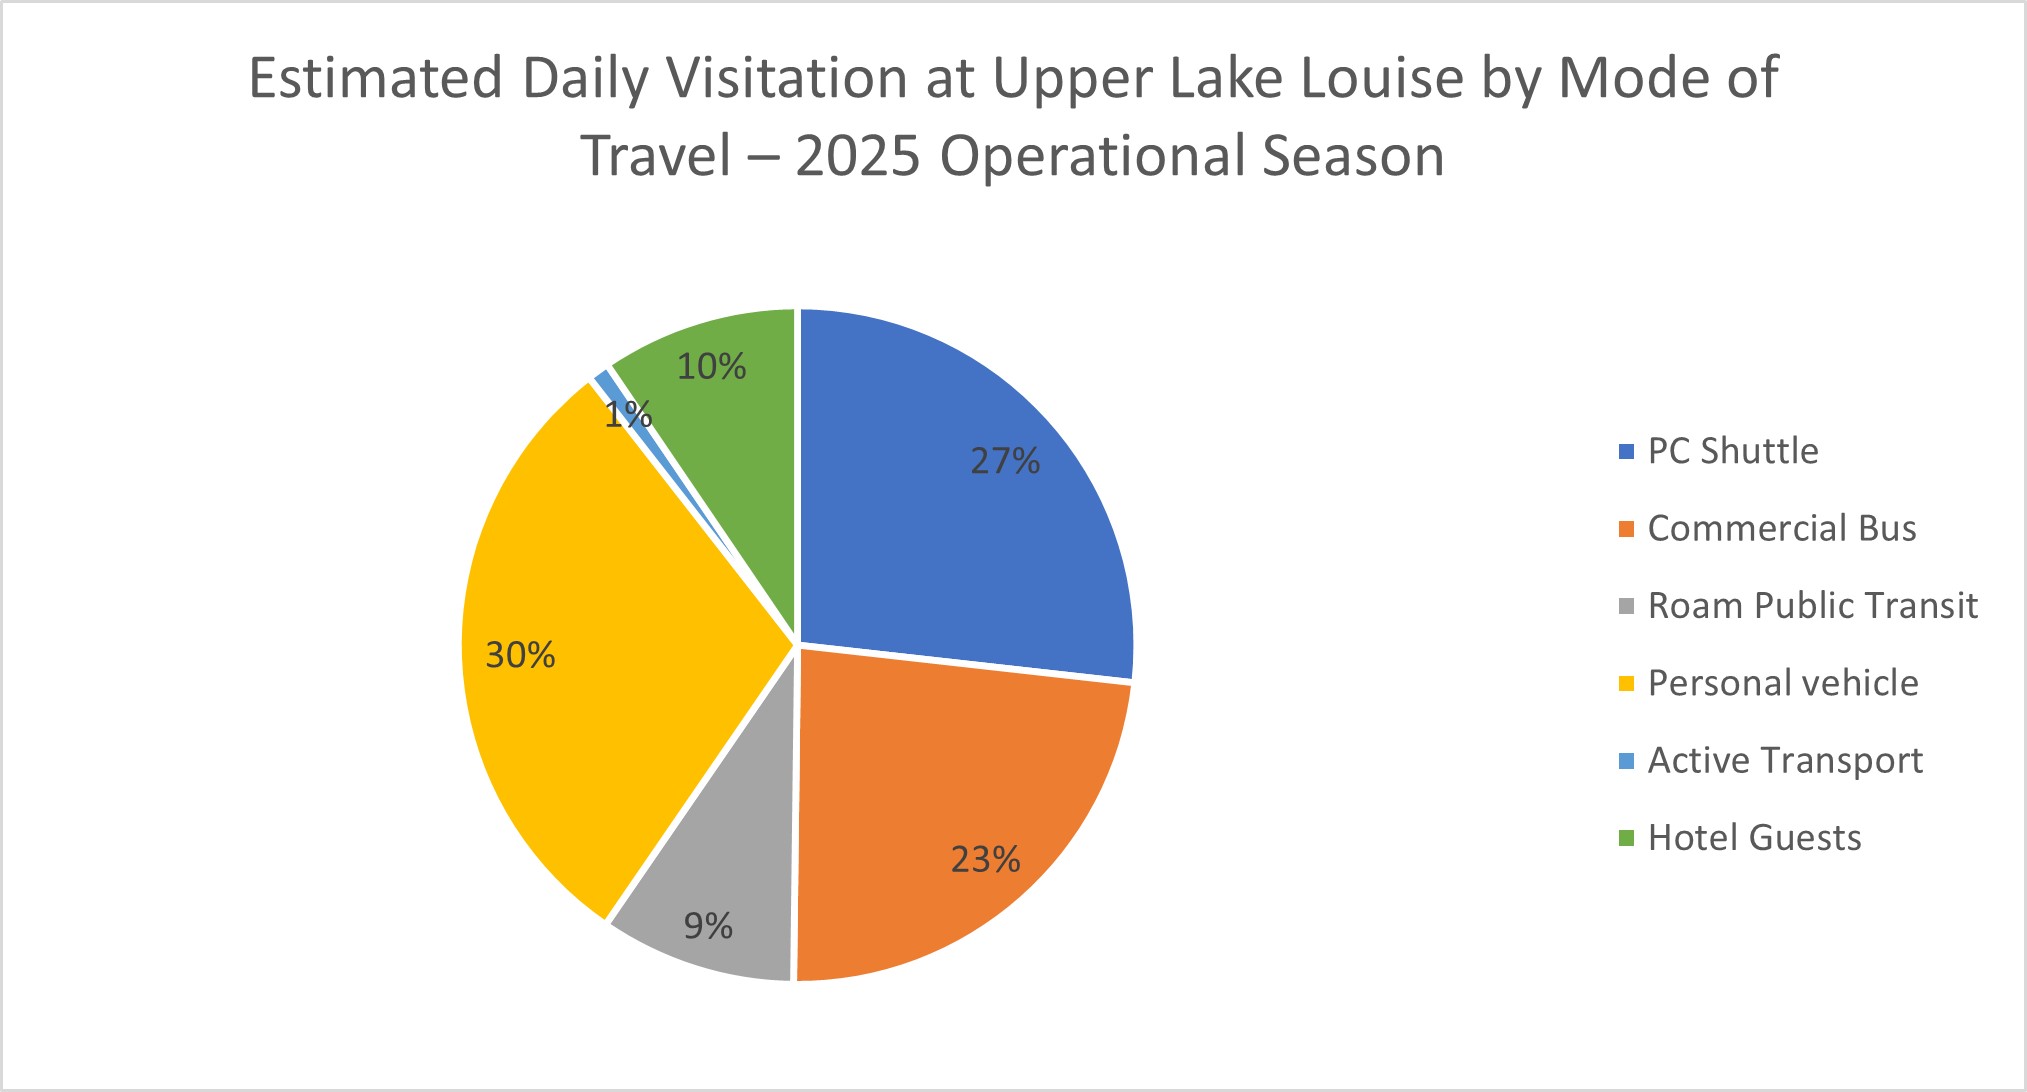
Estimated Daily Visitation at Upper Lake Louise by Mode of Travel (2025 Operational Season) - text version
| Mode of transport | Average # of visitors per day | % of total |
|---|---|---|
| Parks Canada shuttle | 2792 | 27% |
| Commercial bus | 2442 | 23% |
| Roam Public Transit | 979 | 9% |
| Personal vehicle | 3116 | 30% |
| Active transport | 109 | 1% |
| Hotel guests | 990 | 9% |
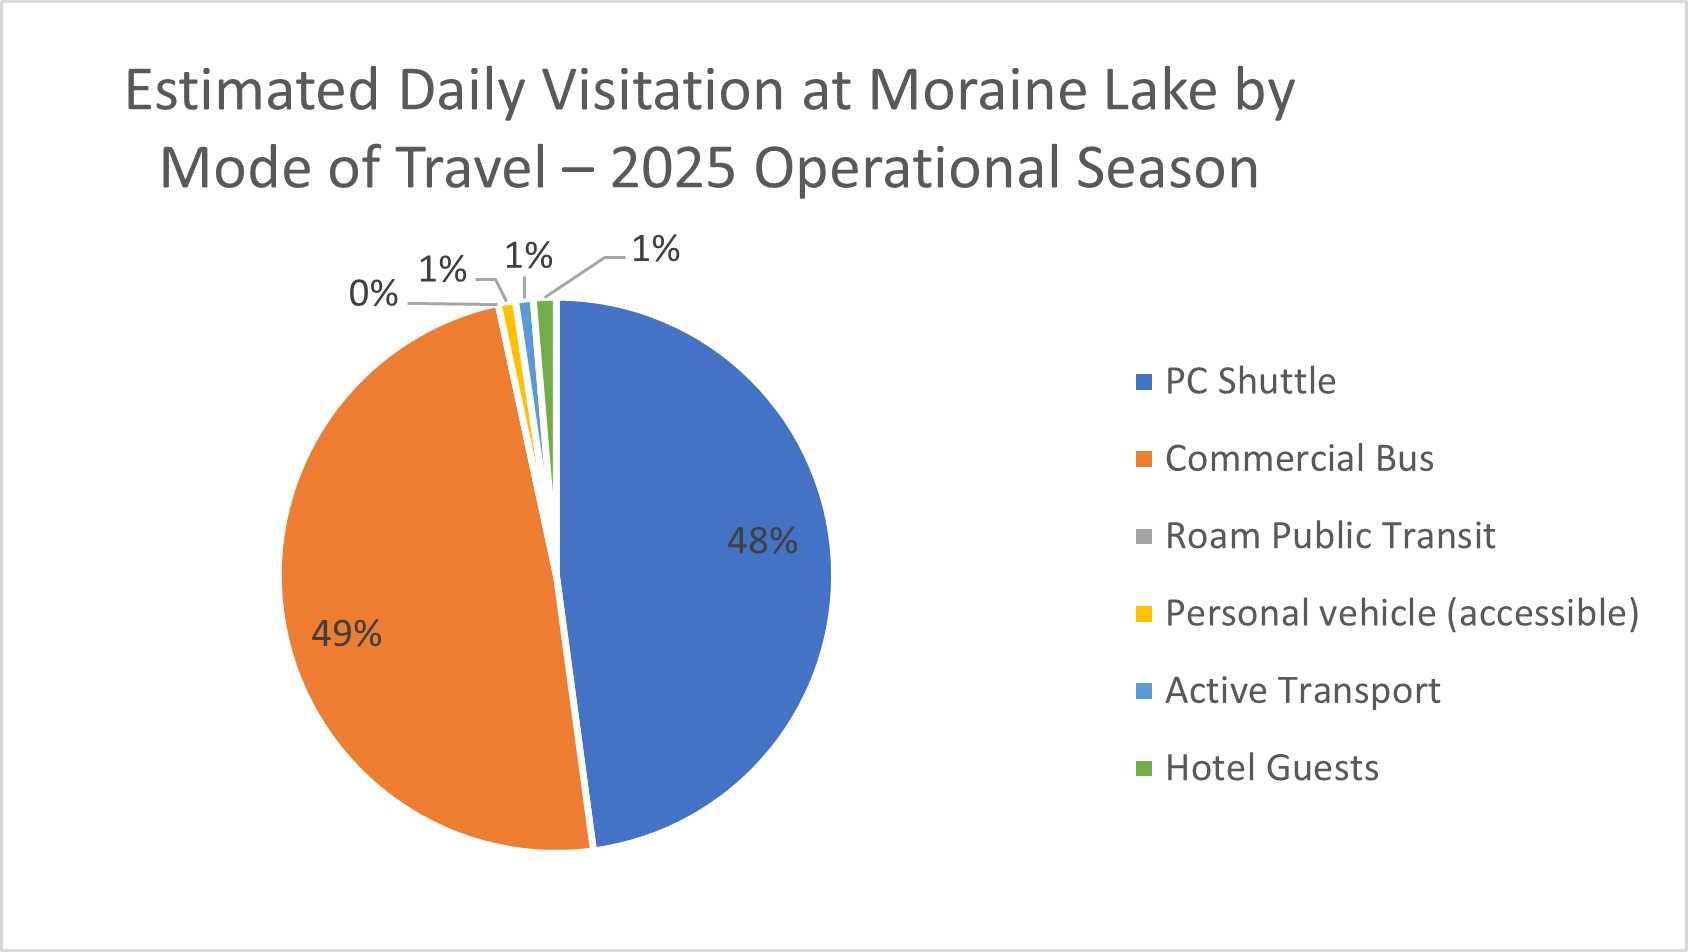
Estimated Daily Visitation at Moraine Lake by Mode of Travel (2025 Operational Season) - text version
| Mode of transport | Average # of visitors per day | % of total |
|---|---|---|
| Parks Canada shuttle | 2802 | 48% |
| Commercial bus | 2854 | 49% |
| Roam Public Transit | 0 | 0% |
| Personal vehicle | 59 | 1% |
| Active transport | 60 | 1% |
| Hotel guests | 78 | 1% |
Level of use over the years
Visitation to Banff National Park has grown over the years.
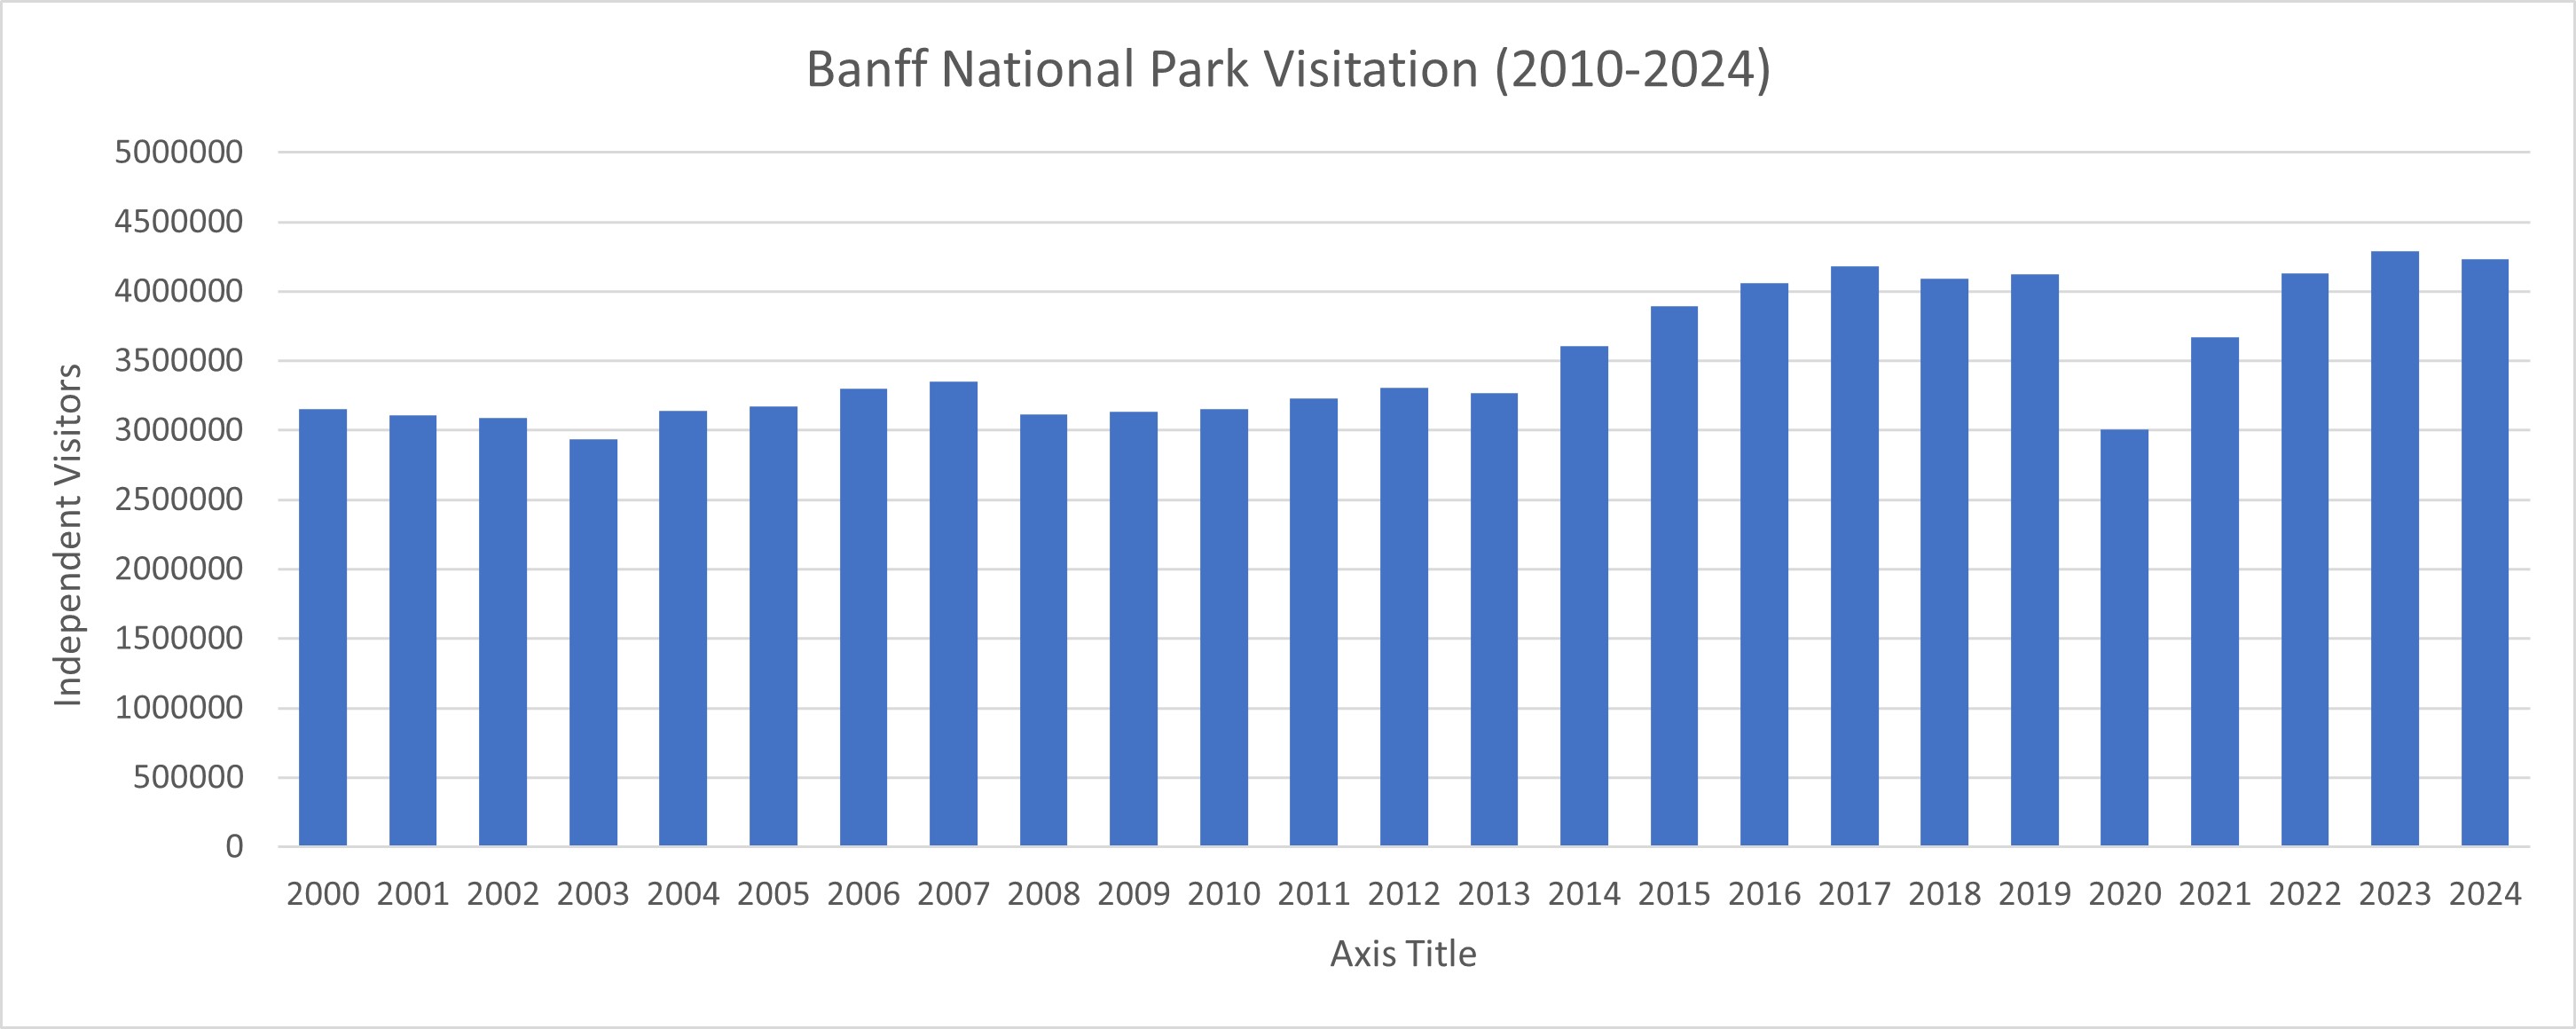
Banff National Park Visitation (2010-2024) - text version
| Year | # of visitors |
|---|---|
| 2000 | 3153279 |
| 2001 | 3106470 |
| 2002 | 3088390 |
| 2003 | 2935140 |
| 2004 | 3139934 |
| 2005 | 3174043 |
| 2006 | 3297460 |
| 2007 | 3348632 |
| 2008 | 3114534 |
| 2009 | 3134348 |
| 2010 | 3151751 |
| 2011 | 3226979 |
| 2012 | 3306203 |
| 2013 | 3268208 |
| 2014 | 3609637 |
| 2015 | 3894333 |
| 2016 | 4059502 |
| 2017 | 4181856 |
| 2018 | 4089308 |
| 2019 | 4121061 |
| 2020 | 3003815 |
| 2021 | 3671554 |
| 2022 | 4130081 |
| 2023 | 4288003 |
| 2024 | 4230156 |
Visitation at Moraine Lake and Lake Louise changed between 2015 and 2025 as various traffic management tools were implemented. The introduction of Parks Canada shuttles increased the number of visitors at these sites. However, as the shuttle system was expanded, further efforts were made to reduce the use of personal vehicles and shift towards a mass transit system. The graphs below show estimated visitation by mode of transport from 2009 to 2025 at Moraine Lake and Lake Louise using daily averages.
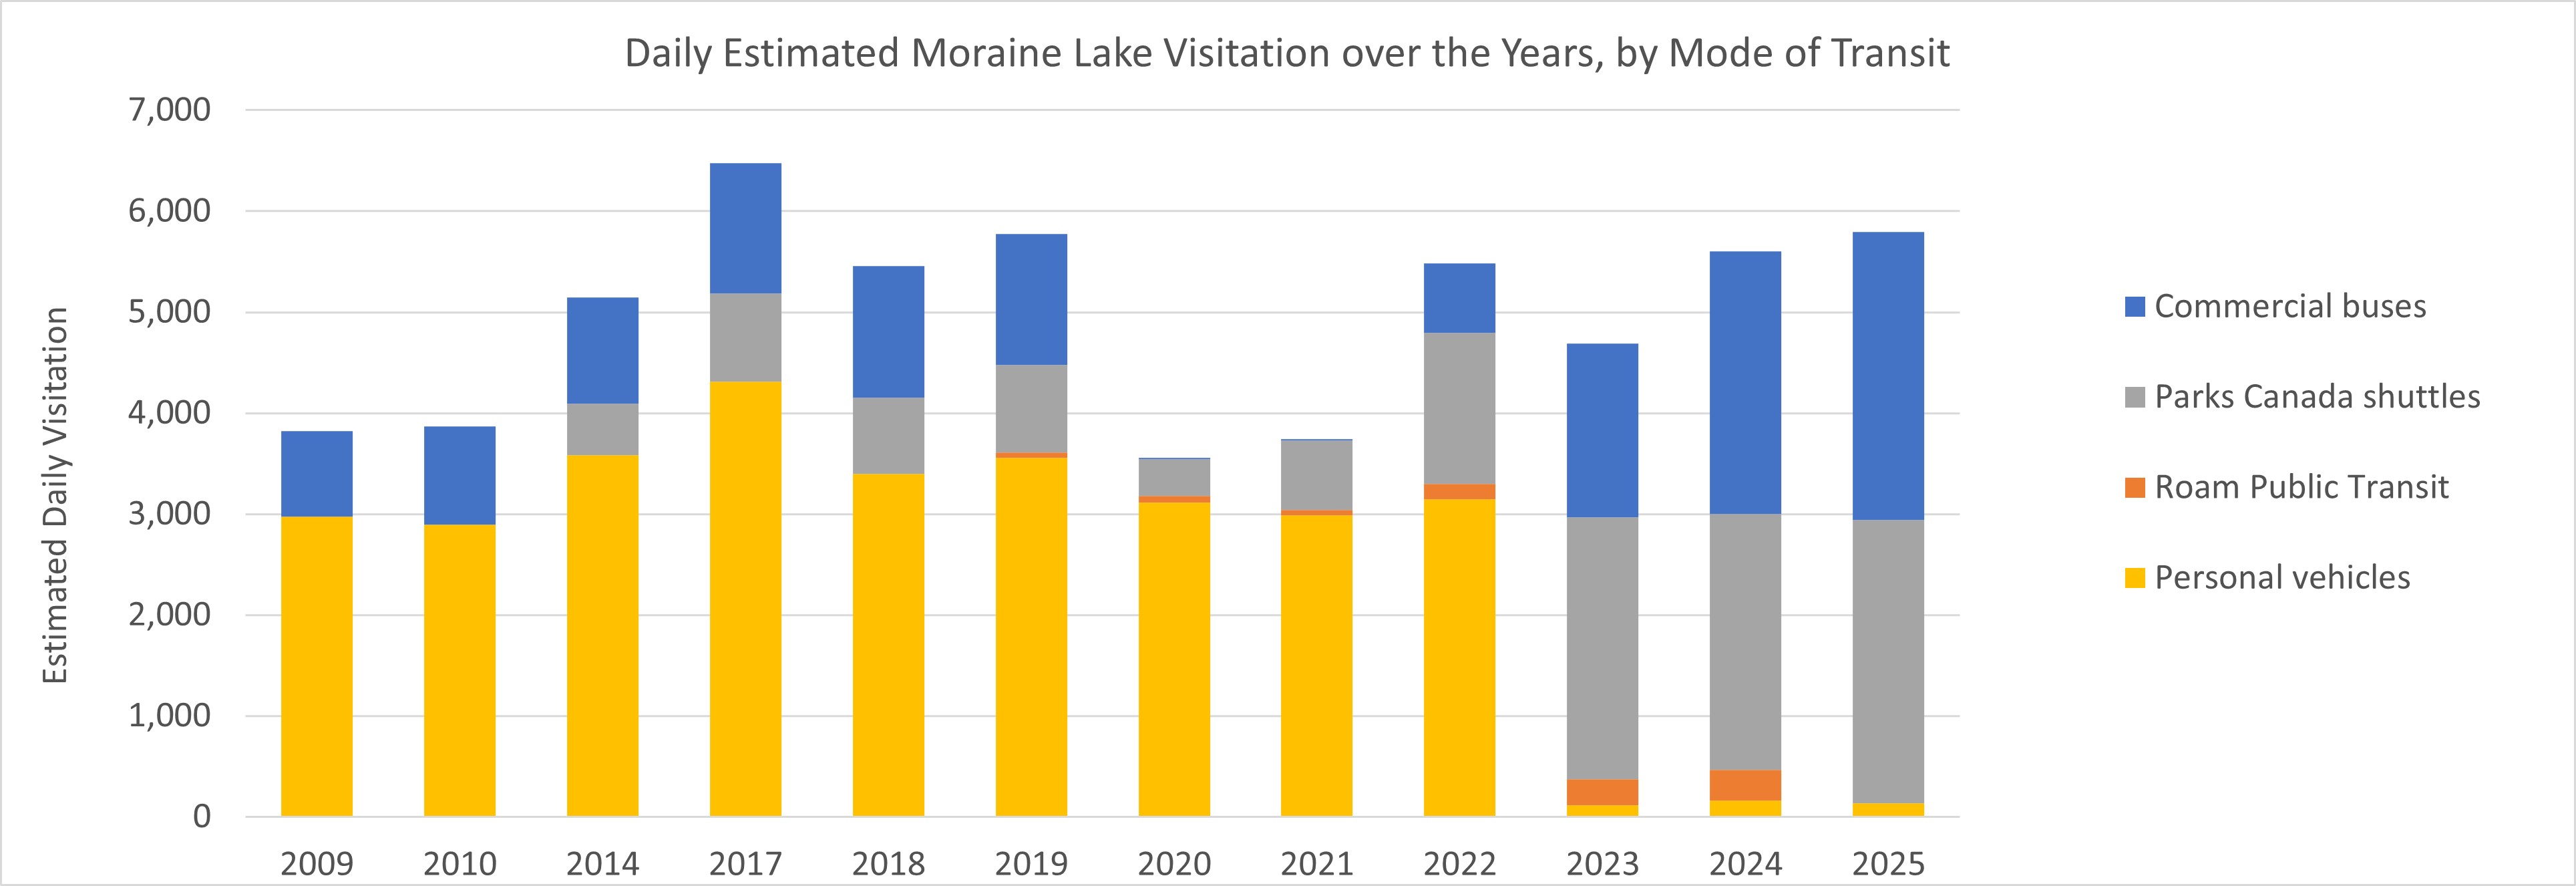
Daily Estimated Moraine Lake Visitation over the Years, by Mode of Transit - text version
| 2009 | 2010 | 2014 | 2017 | 2018 | 2019 | 2020 | 2021 | 2022 | 2023 | 2024 | 2025 | |
|---|---|---|---|---|---|---|---|---|---|---|---|---|
| Personal vehicles | 2976 | 2896 | 3584 | 4312 | 3401 | 3555 | 3113 | 2988 | 3145 | 118 | 160 | 137 |
| Parks Canada shuttles | 0 | 0 | 511 | 877 | 755 | 866 | 365 | 686 | 1490 | 2600 | 2537 | 2802 |
| Commercial buses | 845 | 975 | 1053 | 1287 | 1300 | 1300 | 13 | 13 | 689 | 1715 | 2603 | 2854 |
| Roam Public Transit | 0 | 0 | 0 | 0 | 0 | 55 | 68 | 56 | 157 | 253 | 305 | 0 |
| All modes of transit | 3821 | 3871 | 5148 | 6476 | 5456 | 5776 | 3559 | 3743 | 5481 | 4686 | 5605 | 5356 |
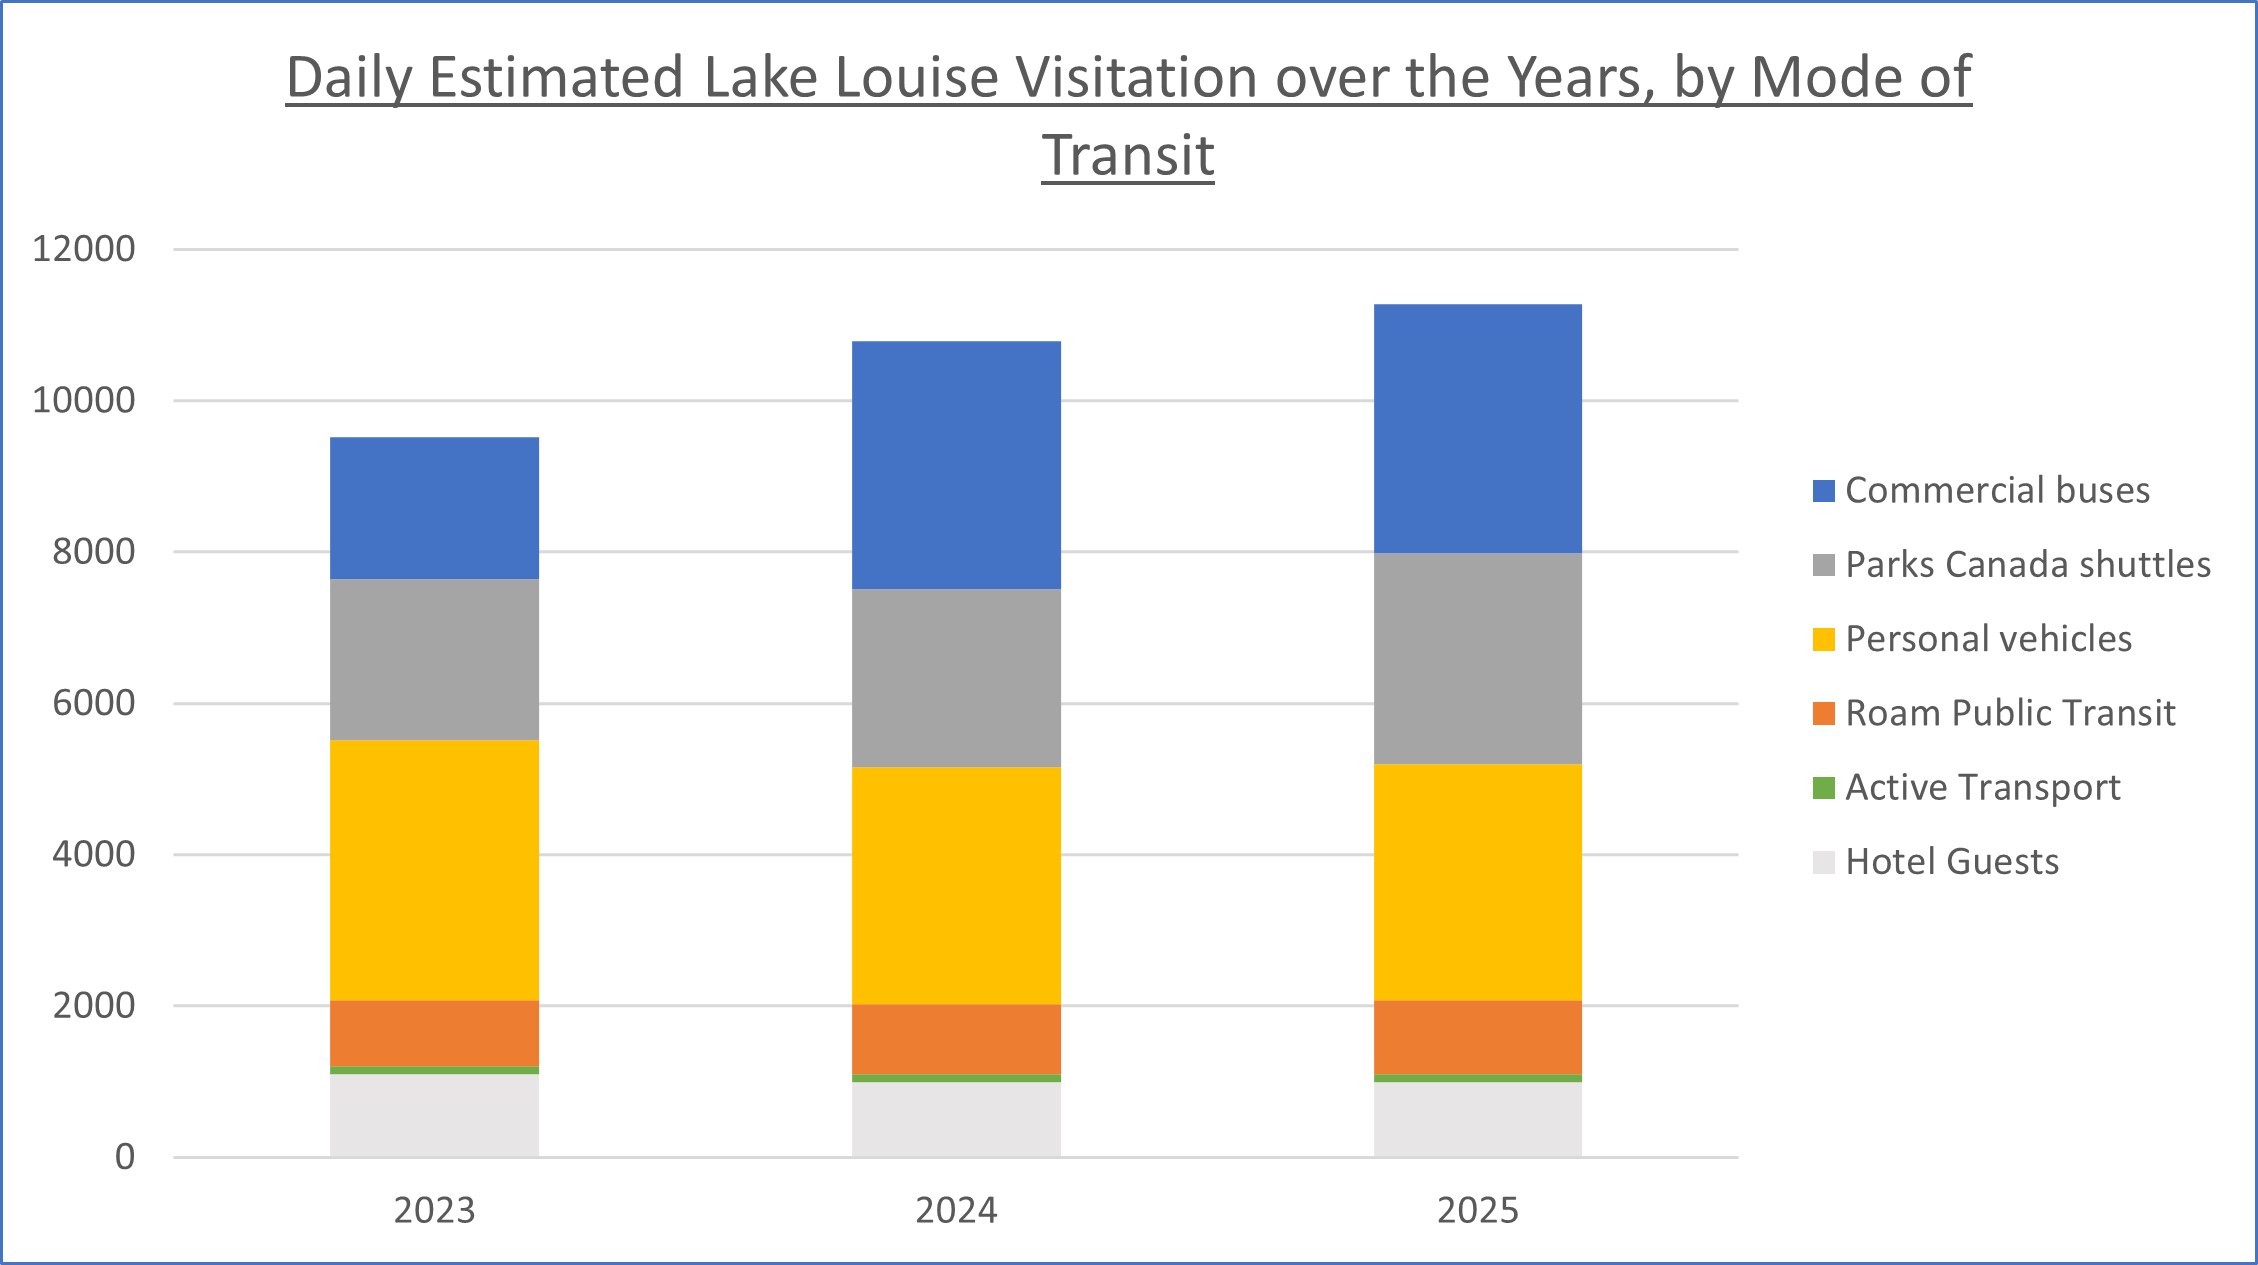
Daily Estimated Lake Louise Visitation over the Years, by Mode of Transit - text version
| Mode of Transit | 2023 | 2024 | 2025 |
|---|---|---|---|
| Personal vehicles | 3444 | 3136 | 3116 |
| Parks Canada shuttles | 2122 | 2351 | 2792 |
| Commercial buses | 1883 | 3274 | 3288 |
| Roam Public Transit | 869 | 922 | 979 |
| Active Transport | 111 | 109 | 109 |
| Hotel Guests | 1095 | 990 | 990 |
| All modes of transit | 9524 | 10782 | 11274 |
Traffic volumes on Moraine Lake Road peaked in 2017. During that year, the parking lot was overflowing, and vehicles parked for several kilometres down the roadway which restricted emergency access. Since personal vehicles were restricted in 2023, traffic volumes have declined over 70% and the number of visitors using mass transit has increased.
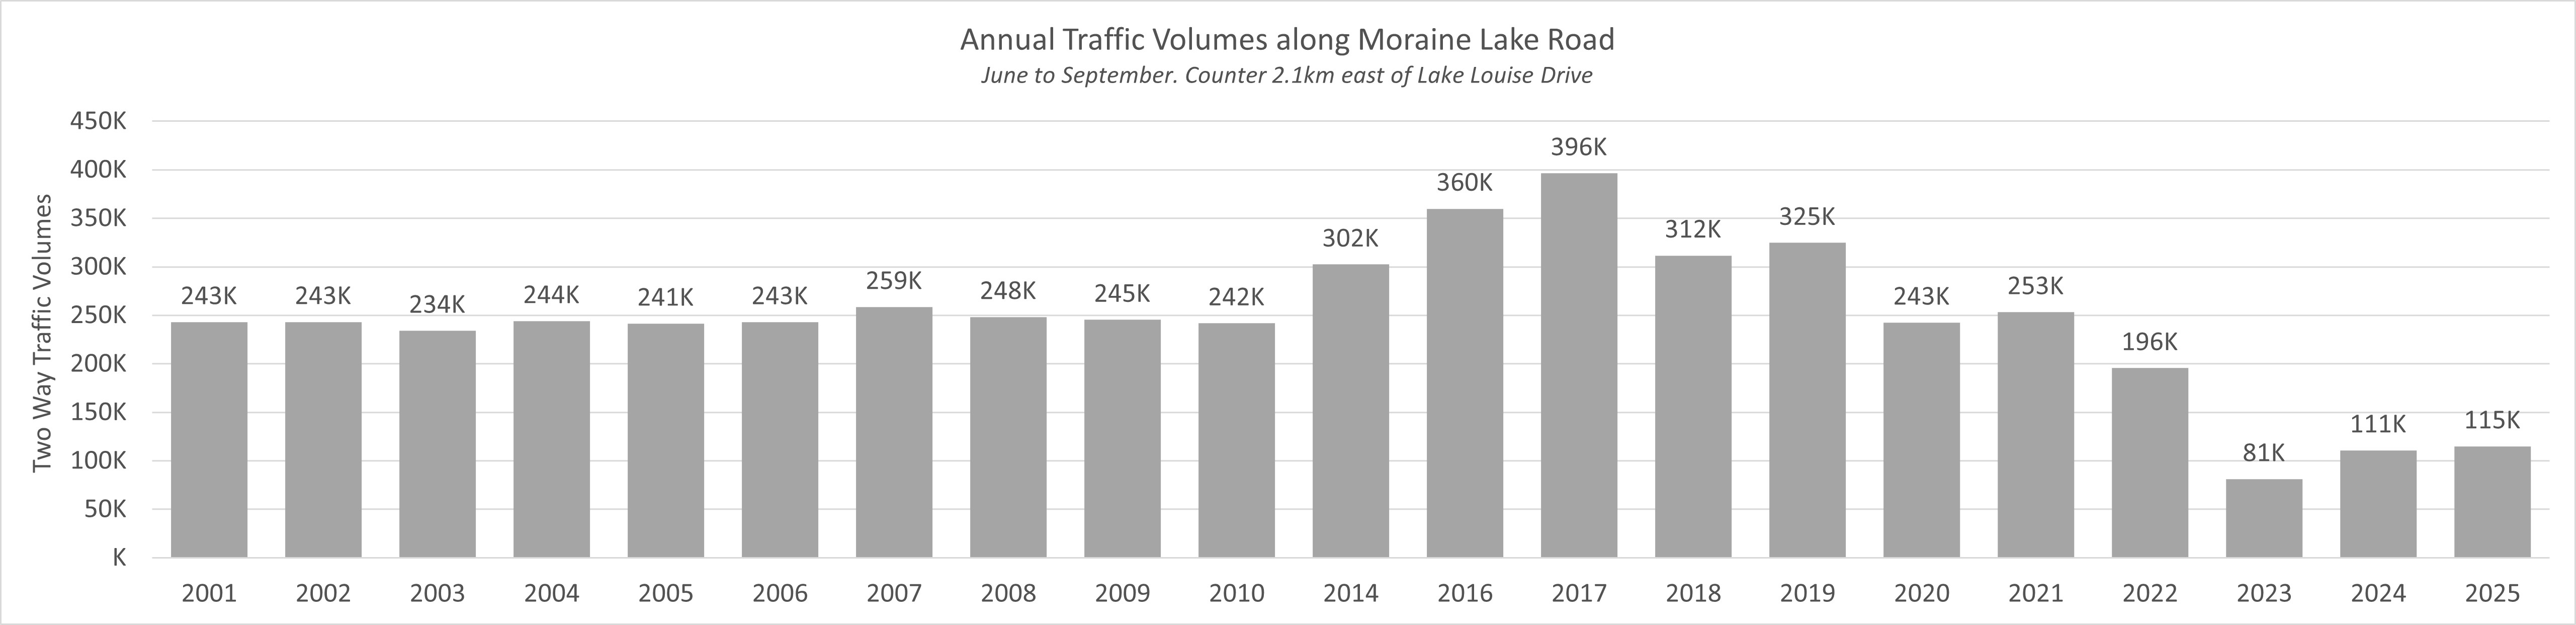
Annual Traffic Volumes along Moraine Lake Road (June to September. Counter 2.1km east of Lake Louise Drive) - text version
| 2001 | 2002 | 2003 | 2004 | 2005 | 2006 | 2007 | 2008 | 2009 | 2010 | 2011-2013 | 2014 | 2015 | 2016 | 2017 | 2018 | 2019 | 2020 | 2021 | 2022 | 2023 | 2024 | 2025 | |
|---|---|---|---|---|---|---|---|---|---|---|---|---|---|---|---|---|---|---|---|---|---|---|---|
| Two way traffic volumes | 242,982 | 243,083 | 234,131 | 244,041 | 241,434 | 242,923 | 258,619 | 248,290 | 245,412 | 241,804 | No data | 302,412 | No data | 359,945 | 396,481 | 311,681 | 324,713 | 242,529 | 253,248 | 195,595 | 81,177 | 110,814 | 114,936 |
Due to data constraints, estimating the exact number of visitors over the years for Upper Lake Louise is complex. However, we can still look at traffic volumes, shuttle ridership, parking permits and trail use to infer visitation levels.
The graph below shows annual two-way traffic volumes along Lake Louise Drive from 2001 to 2025. Traffic volumes spiked in 2019 and have since seen a 24% decrease.
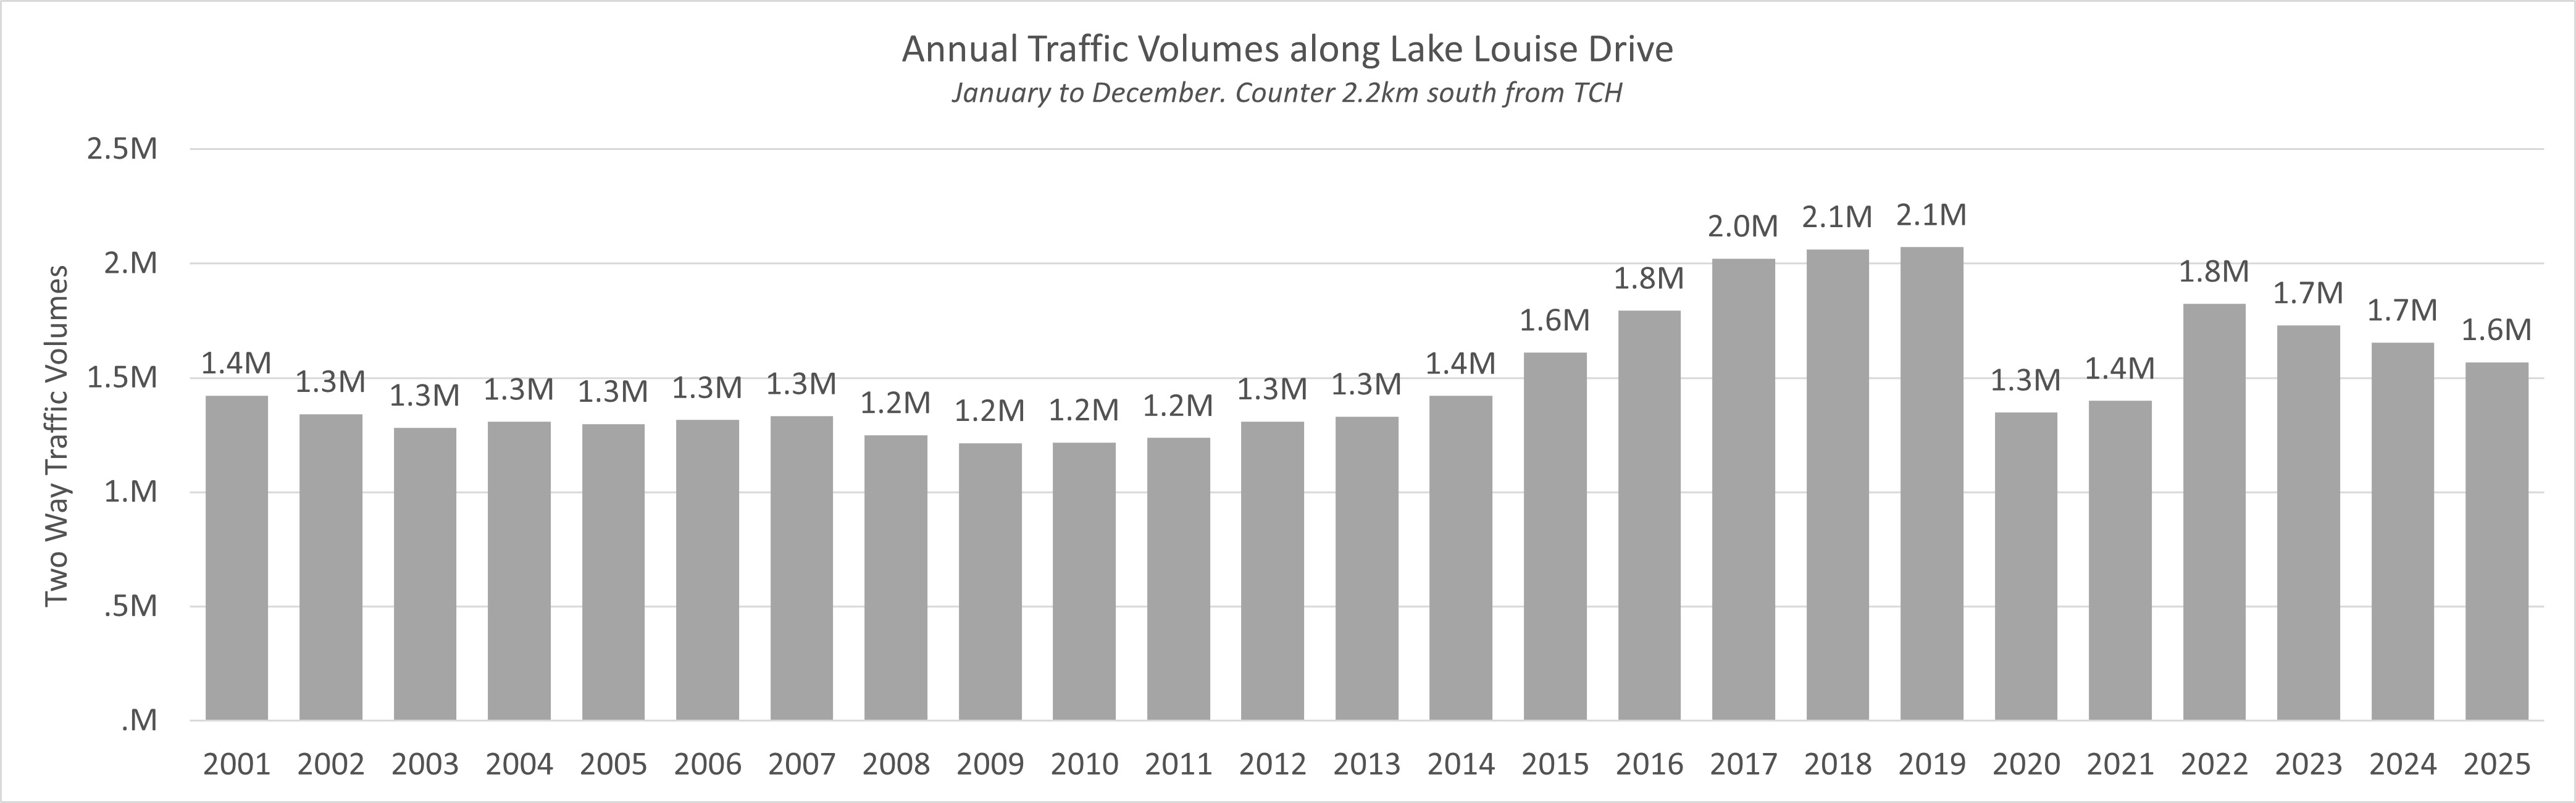
Annual Traffic Volumes along Lake Louise Drive (January to December. Counter 2.2km south from TCH) - text version
| 2001 | 2002 | 2003 | 2004 | 2005 | 2006 | 2007 | 2008 | 2009 | 2010 | 2011 | 2012 | 2013 | 2014 | 2015 | 2016 | 2017 | 2018 | 2019 | 2020 | 2021 | 2022 | 2023 | 2024 | 2025 | |
|---|---|---|---|---|---|---|---|---|---|---|---|---|---|---|---|---|---|---|---|---|---|---|---|---|---|
| Two way traffic volumes | 1,423,068 | 1,341,850 | 1,281,676 | 1,308,298 | 1,298,712 | 1,315,475 | 1,332,416 | 1,249,326 | 1,214,759 | 1,217,721 | 1,236,934 | 1,309,458 | 1,330,746 | 1,421,190 | 1,610,759 | 1,794,183 | 2,021,921 | 2,062,692 | 2,071,838 | 1,348,444 | 1,399,480 | 1,824,200 | 1,729,639 | 1,654,329 | 1,568,877 |
The graph below shows average daily shuttle ridership to Lake Louise and Moraine Lake from 2013 to 2025. Daily ridership has increased significantly from 2021-2023.
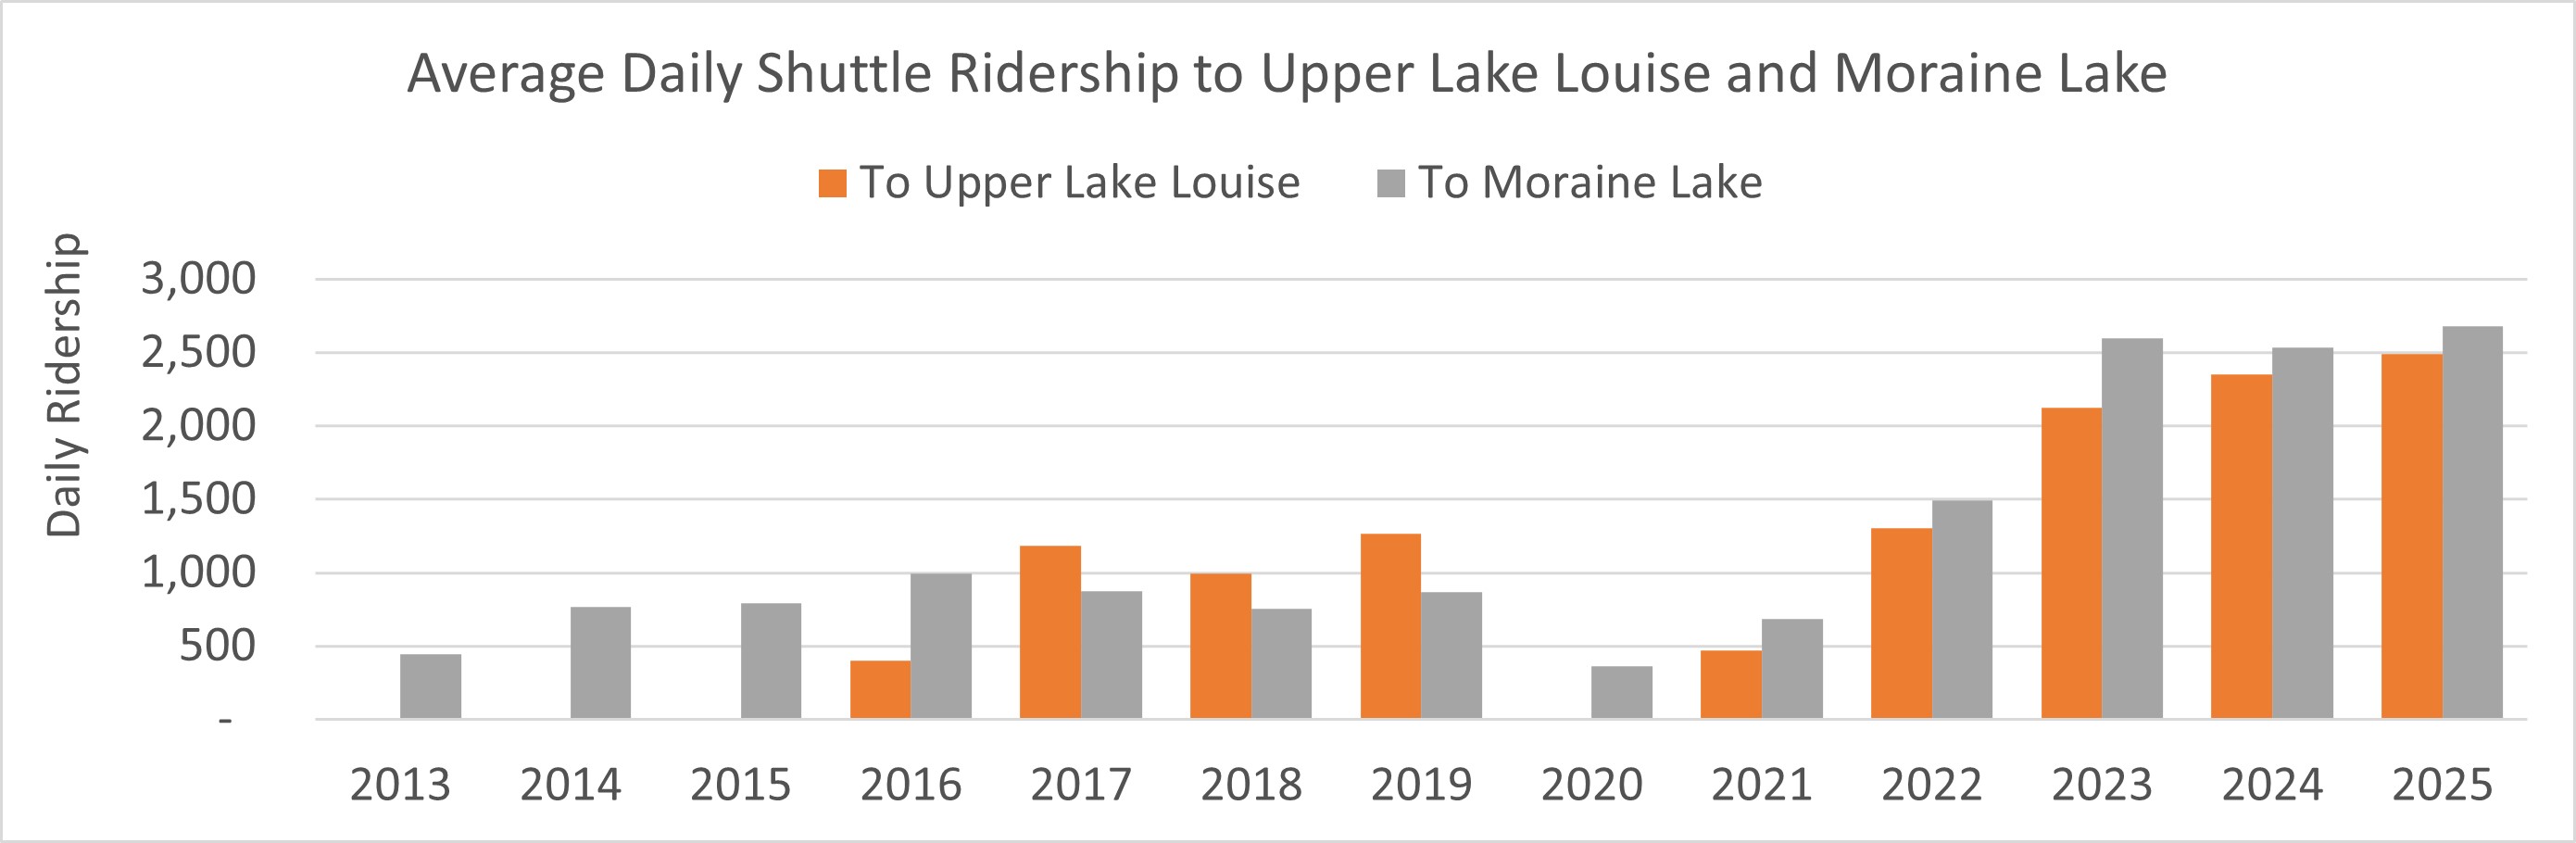
Average Daily Shuttle Ridership to Upper Lake Louise and Moraine Lake in 2025 - text version
| 2013 | 2014 | 2015 | 2016 | 2017 | 2018 | 2019 | 2020 | 2021 | 2022 | 2023 | 2024 | 2025 | |
|---|---|---|---|---|---|---|---|---|---|---|---|---|---|
| To Upper Lake Louise | - | - | - | 400 | 1,182 | 992 | 1,265 | - | 469 | 1,303 | 2,122 | 2,351 | 2,488 |
| To Moraine Lake | 447 | 767 | 789 | 994 | 877 | 755 | 866 | 365 | 686 | 1,490 | 2,600 | 2,537 | 2,682 |
Using active transportation (e.g. hiking, biking) to access Lake Louise and Moraine Lake has increased over the years. Trail use around Lake Louise Drive (which is bisected by the Fairview wildlife corridor) have risen since 2022.
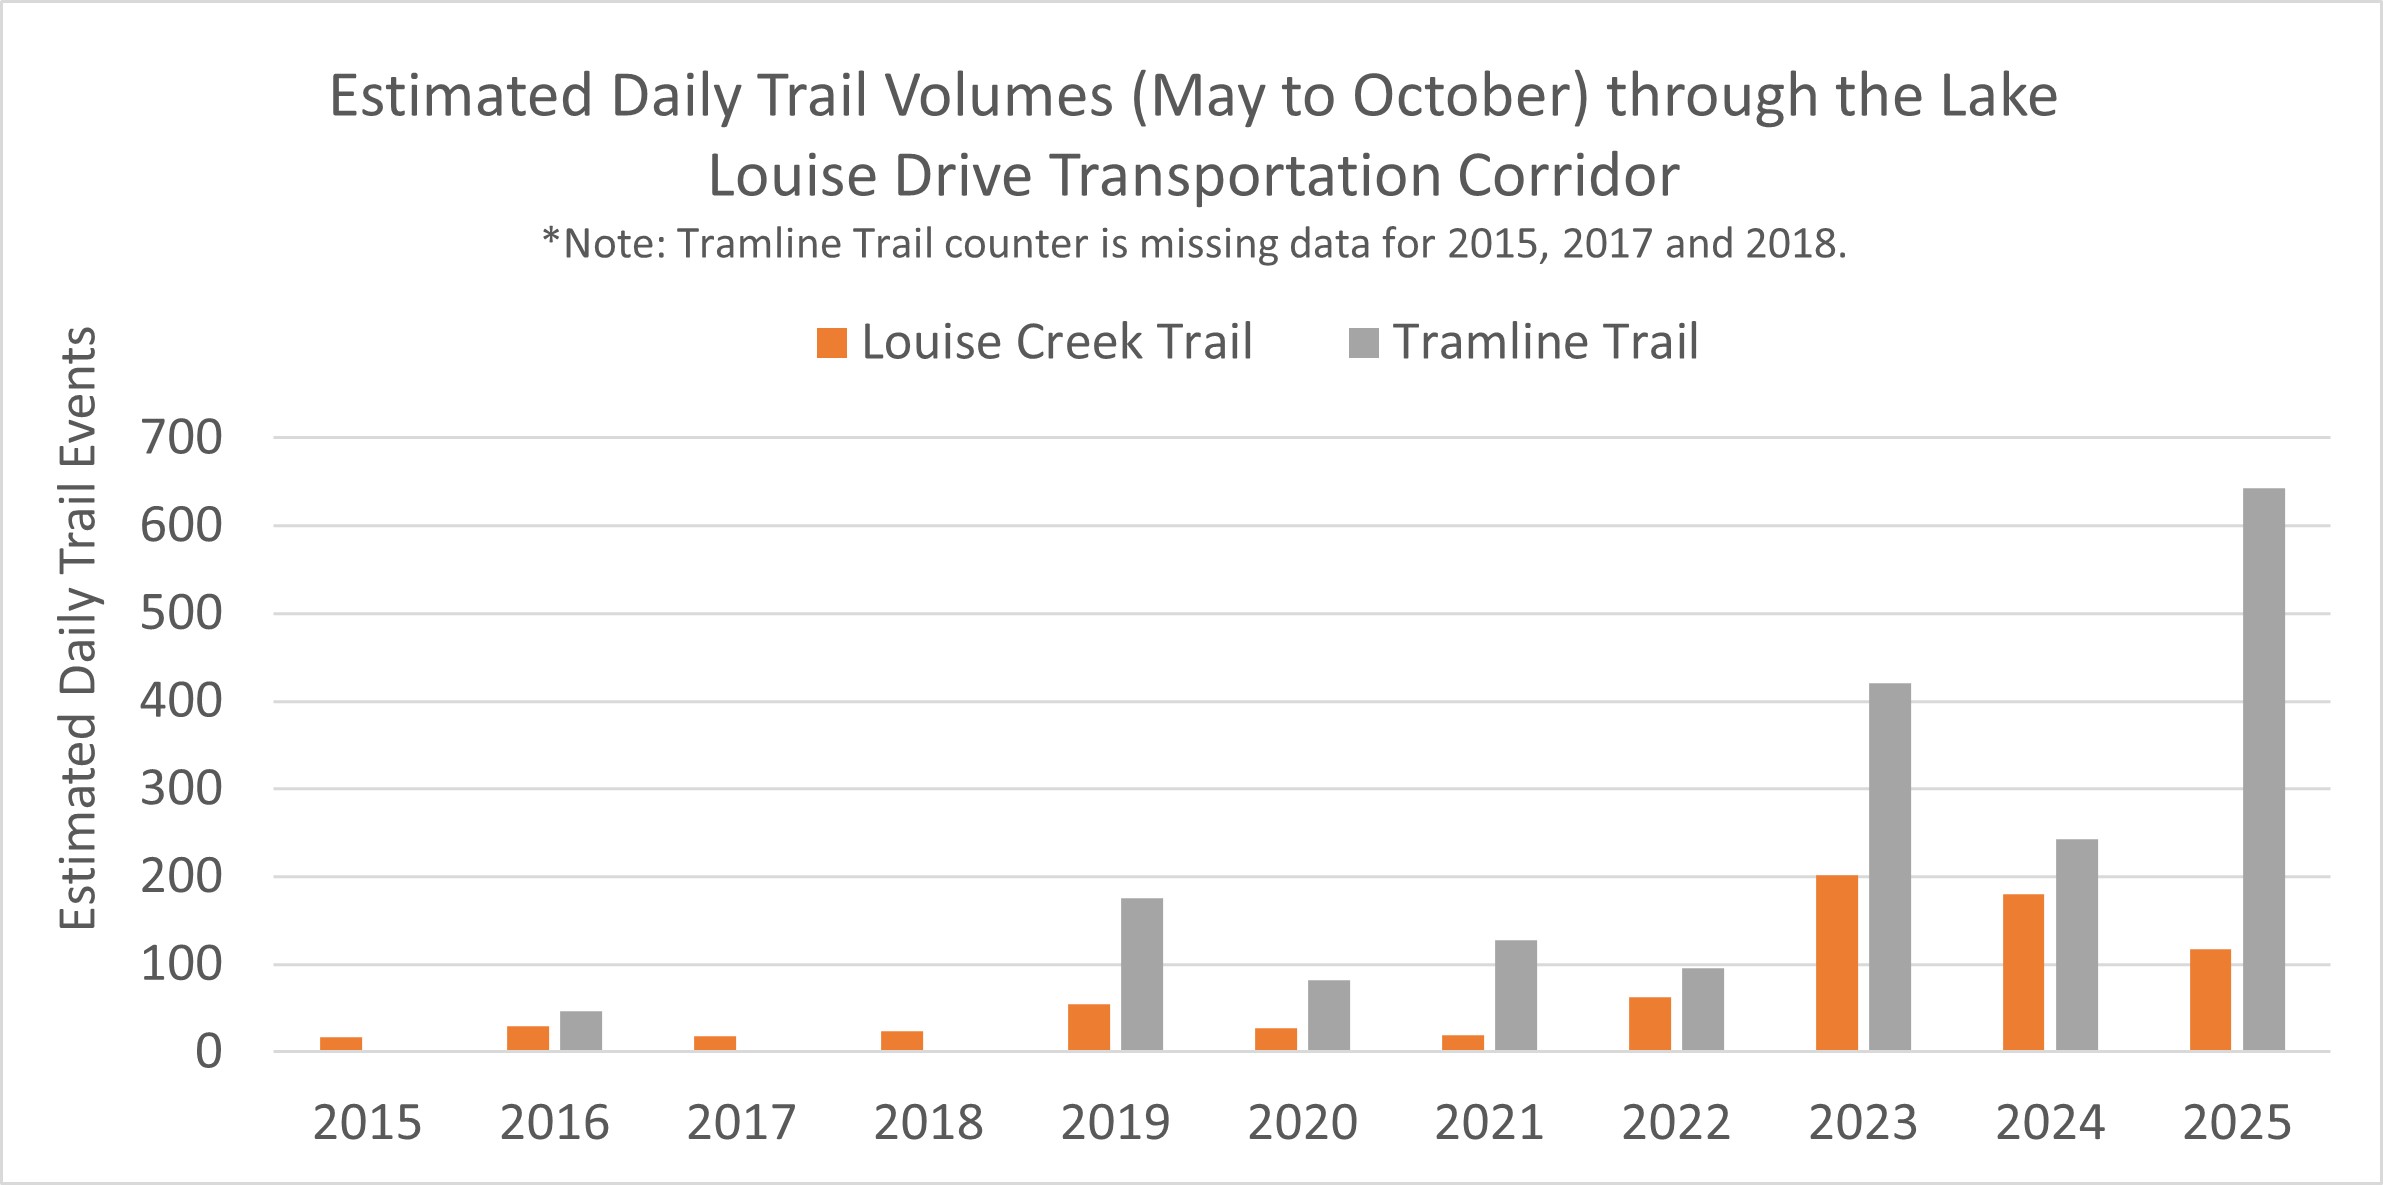
Annual Estimated Trail Volumes through the Lake Louise Drive Transportation Corridor - text version
Note: Tramline Trail counter is missing data for 2015, 2017 and 2018.
| 2015 | 2016 | 2017 | 2018 | 2019 | 2020 | 2021 | 2022 | 2023 | 2024 | 2025 | |
|---|---|---|---|---|---|---|---|---|---|---|---|
| Louise Creek trail | 17 | 30 | 19 | 24 | 54 | 27 | 19 | 63 | 202 | 180 | 117 |
| Tramline trail | - | 47 | - | - | 176 | 81 | 127 | 95 | 421 | 243 | 642 |
Timing of use
Throughout the year
Visitation in the Lake Louise area mirrors trends for Banff National Park as a whole. Visitation peaks during July and August. The shoulder season (April, May, and October) became busier between 2013 and 2025. The exception is the Larch Valley Trail in the Moraine Lake area which sees peak use during the fall larch season.
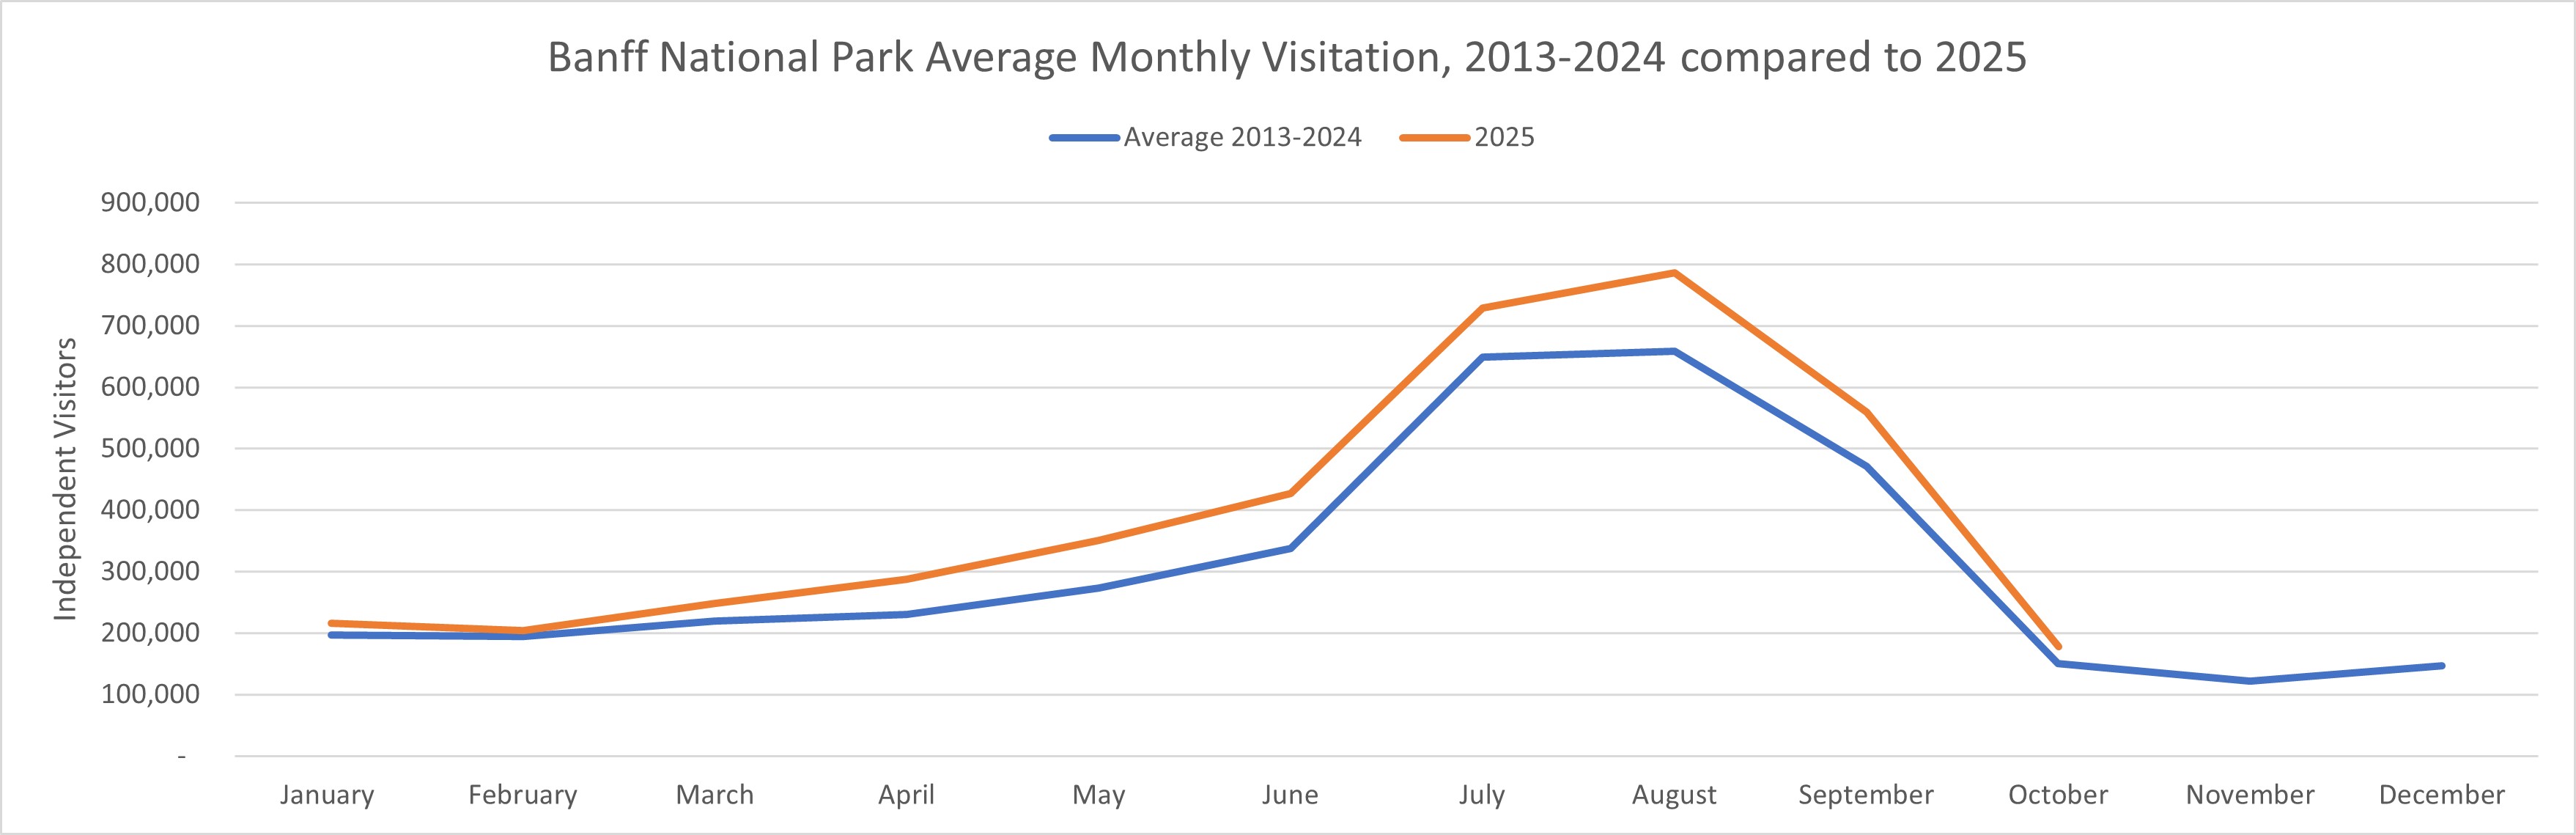
Banff National Park Average Monthly Visitation, 2013-2024 compared to 2025 - text version
| 2022 | 2023 | 2024 | Average 2013-2024 | 2025 | |
|---|---|---|---|---|---|
| January | 210,293 | 212,800 | 199,295 | 196,594 | 216,229 |
| February | 216,405 | 205,379 | 217,032 | 194,190 | 203,491 |
| March | 239,529 | 237,440 | 244,691 | 219,682 | 248,147 |
| April | 278,486 | 283,215 | 258,851 | 230,128 | 287,478 |
| May | 321,116 | 327,200 | 333,058 | 272,709 | 350,621 |
| June | 361,655 | 393,564 | 417,162 | 338,242 | 426,958 |
| July | 694,127 | 718,191 | 693,816 | 648,636 | 729,224 |
| August | 685,408 | 696,030 | 670,789 | 659,018 | 785,940 |
| September | 534,378 | 534,099 | 501,139 | 470,989 | 559,107 |
| October | 164,404 | 164,677 | 165,466 | 150,359 | 177,463 |
| November | 117,864 | 130,184 | 131,299 | 121,402 | - |
| December | 143,765 | 163,303 | 165,233 | 146,924 | - |
After the relocation of the Lake Louise Park and Ride to the Lake Louise Ski Area, there was a shift in traffic patterns on Whitehorn Road. Peak use on this road is now during July and August, higher than peak ski season in January through March.
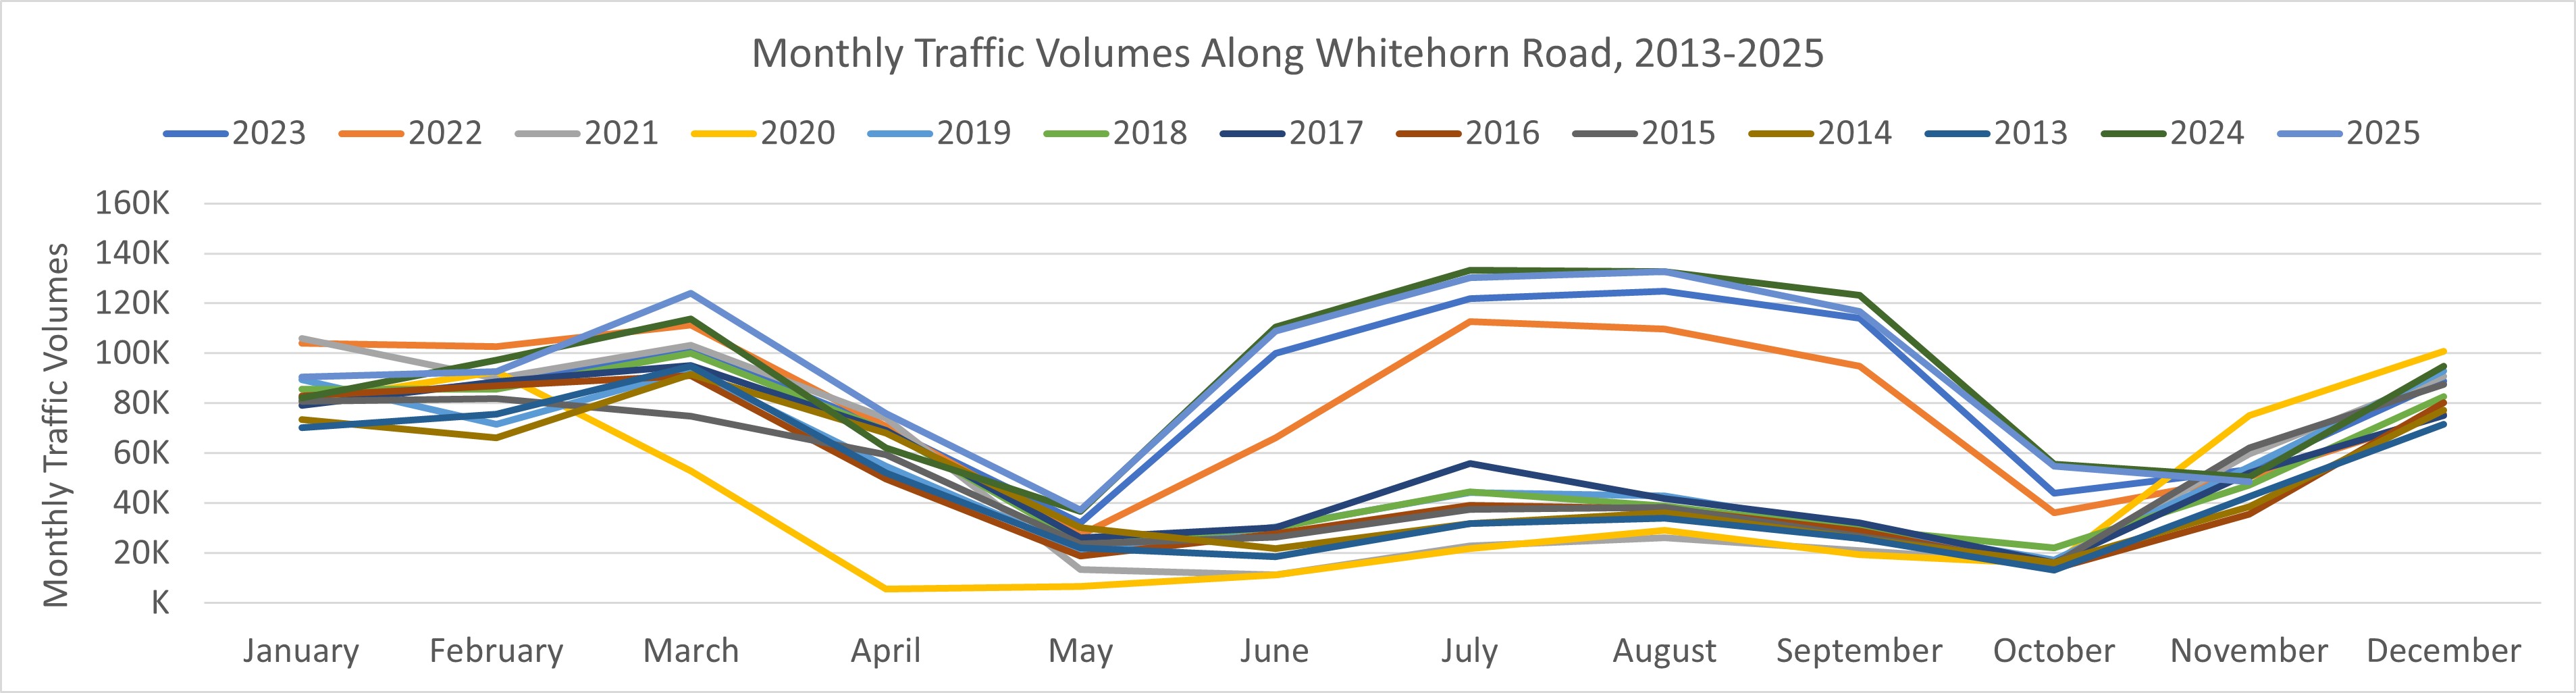
Monthly Traffic Volumes Along Whitehorn Road, 2013-2025 - text version
| January | February | March | April | May | June | July | August | September | October | November | December | |
|---|---|---|---|---|---|---|---|---|---|---|---|---|
| 2025 | 90,520 | 92,725 | 124,160 | 75,913 | 37,378 | 108,834 | 130,319 | 132,673 | 116,749 | 54,955 | 48,675 | - |
| 2024 | 82,231 | 97,283 | 113,744 | 62,038 | 36,613 | 110,454 | 133,356 | 132,635 | 123,341 | 55,585 | 50,631 | 94,813 |
| 2023 | 81,073 | 88,195 | 101,742 | 69,998 | 32,203 | 99,895 | 121,934 | 124,909 | 114,000 | 44,036 | 53,470 | 88,911 |
| 2022 | 103,934 | 102,604 | 111,209 | 70,835 | 27,351 | 66,178 | 112,634 | 109,667 | 94,772 | 36,107 | 50,429 | 75,727 |
| 2021 | 105,979 | 90,028 | 103,241 | 74,115 | 13,504 | 11,213 | 22,841 | 26,094 | 21,001 | 15,840 | 59,787 | 90,781 |
| 2020 | 80,522 | 92,617 | 52,834 | 5,552 | 6,619 | 11,192 | 21,714 | 29,196 | 19,429 | 15,669 | 75,136 | 100,719 |
| 2019 | 89,429 | 71,524 | 93,259 | 54,891 | 21,331 | 30,471 | 44,260 | 42,986 | 30,164 | 17,247 | 54,476 | 93,020 |
| 2018 | 85,672 | 85,677 | 99,947 | 69,057 | 24,513 | 30,141 | 44,563 | 38,842 | 29,638 | 22,162 | 47,124 | 82,636 |
| 2017 | 79,170 | 88,662 | 95,060 | 69,290 | 26,075 | 30,323 | 55,785 | 41,796 | 32,206 | 16,222 | 52,202 | 75,148 |
| 2016 | 83,057 | 86,940 | 91,089 | 49,630 | 18,763 | 27,896 | 39,034 | 37,823 | 28,767 | 13,836 | 35,593 | 80,368 |
| 2015 | 80,809 | 81,887 | 74,918 | 59,359 | 23,850 | 26,315 | 37,472 | 38,277 | 26,835 | 15,727 | 62,061 | 87,641 |
| 2014 | 73,375 | 66,256 | 91,704 | 68,003 | 30,201 | 21,975 | 31,814 | 36,096 | 25,849 | 16,110 | 38,606 | 77,345 |
| 2013 | 70,300 | 75,579 | 94,853 | 52,126 | 22,112 | 18,586 | 31,892 | 34,124 | 25,891 | 13,139 | 42,676 | 71,544 |
Throughout the day
The amount of time visitors spend at Moraine Lake and Lake Louise is highly variable. Visitors stay anywhere from 30 minutes to over 16 hours depending on their activity. Parks Canada estimates that the average length of stay is 2.5 hours at Upper Lake Louise, and 1.5 hours at Moraine Lake.
Traffic volumes can help determine the busiest times of visitation throughout the day. In 2025, visitor use began in the Upper Lake Louise area around 5 am and lasted until 10 pm (May to October). Peak use occurs around 1 pm to 3 pm. During July and August, peak visitation extends even further into the dawn and dusk hours.
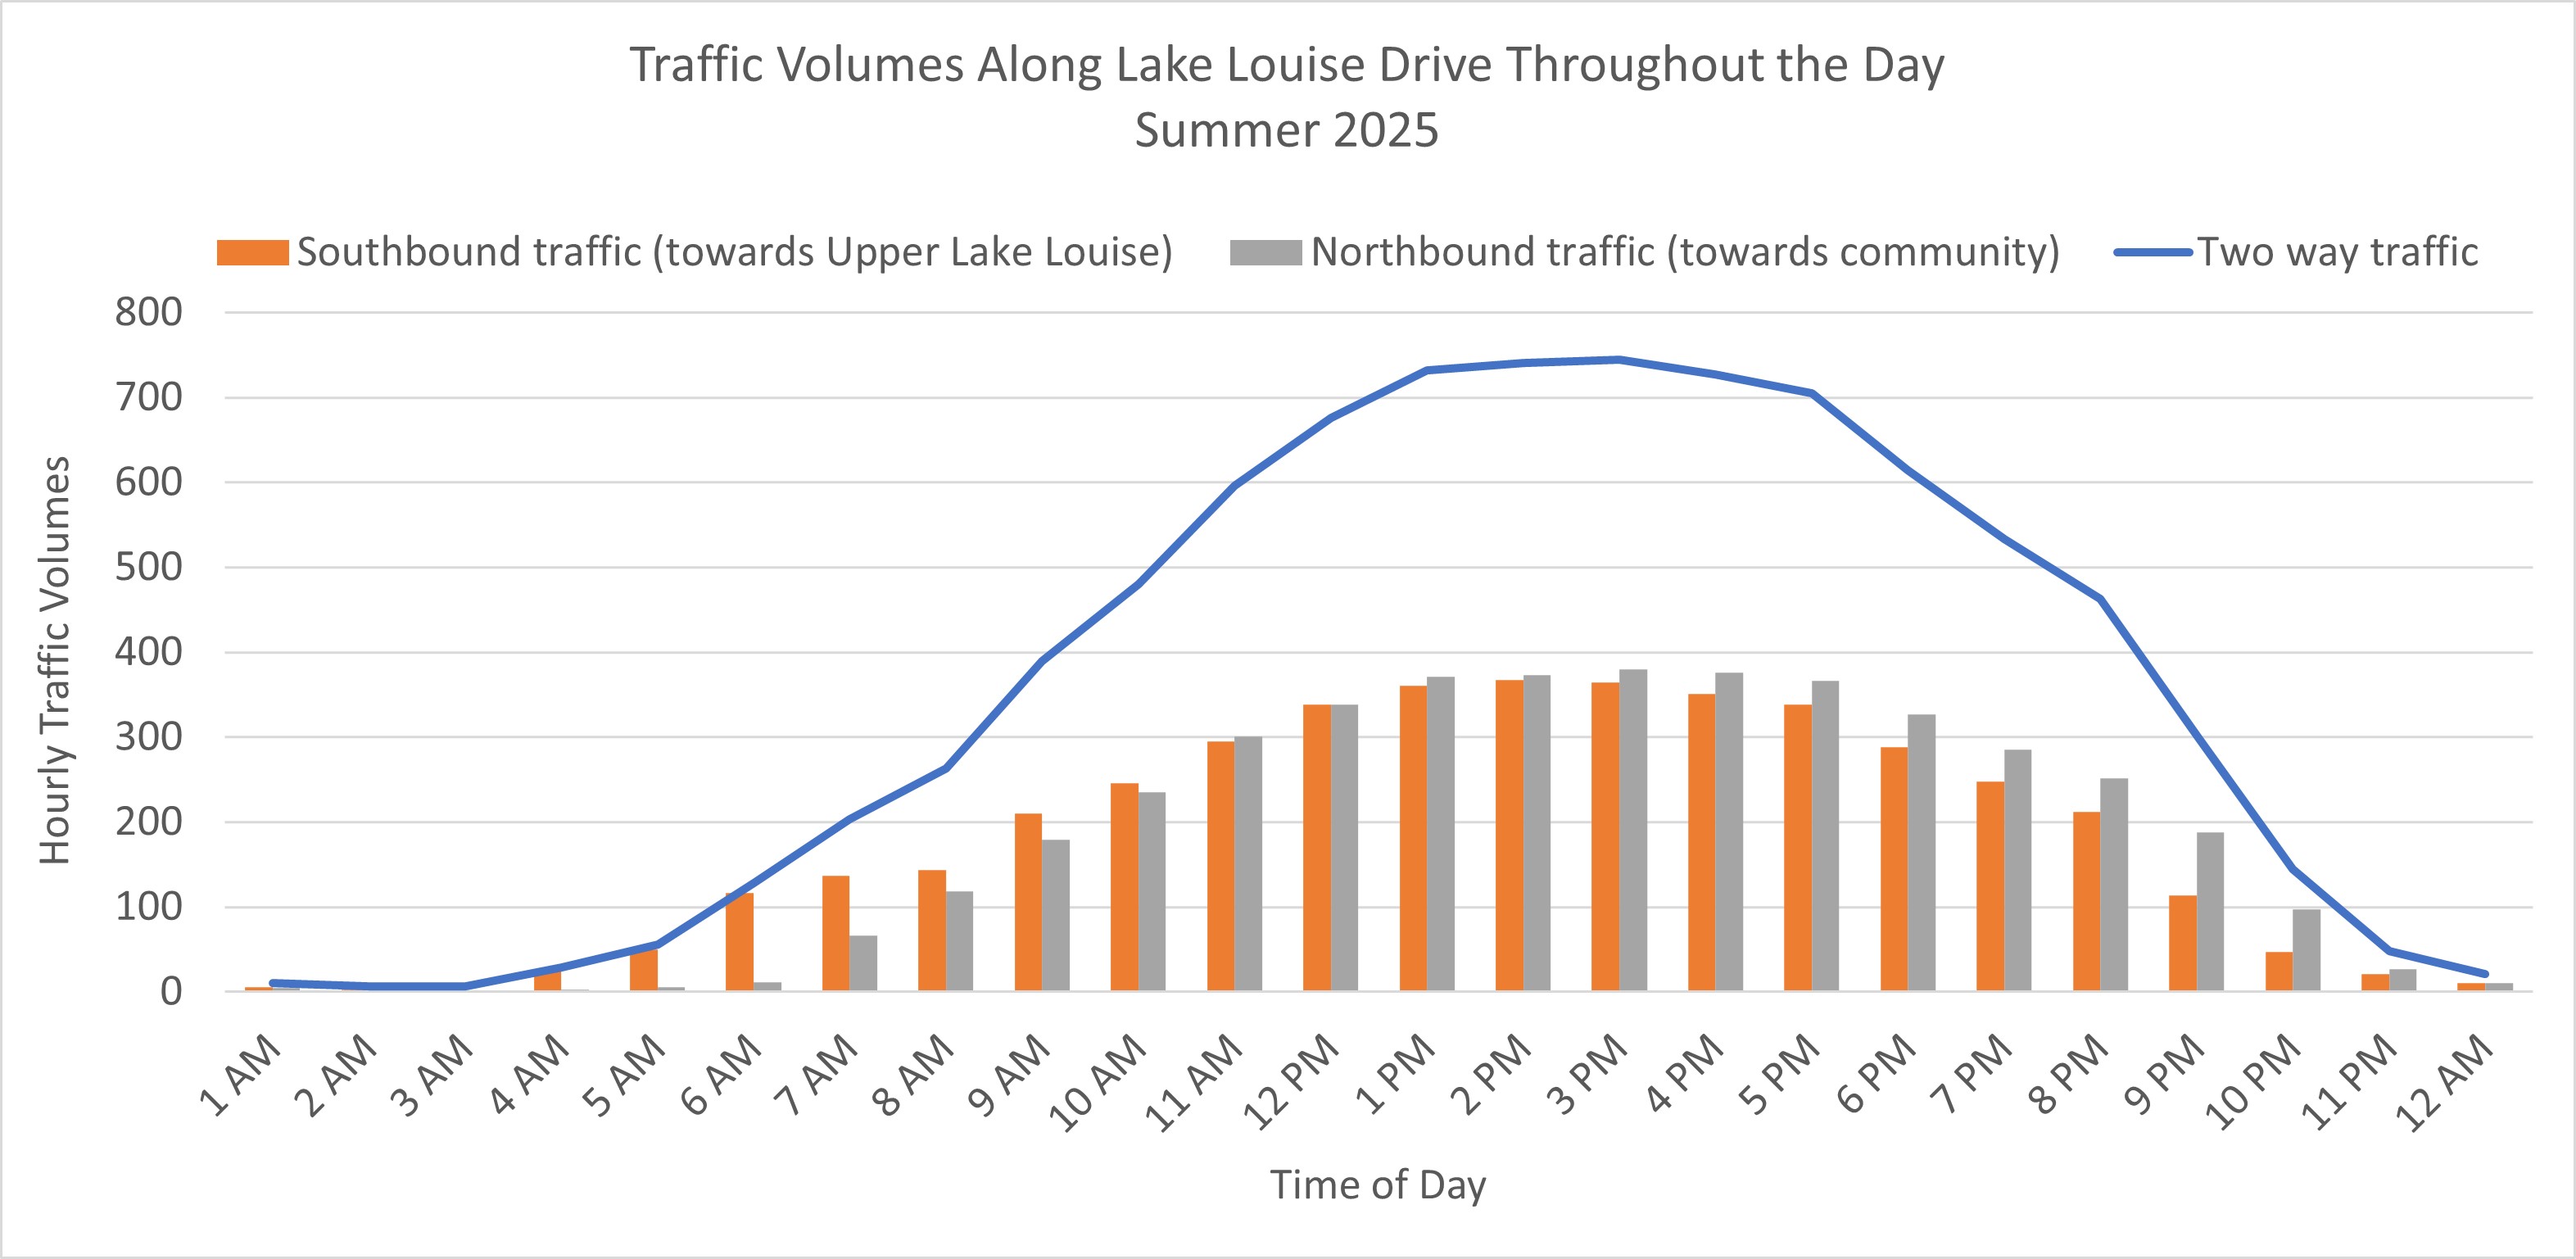
Traffic Volumes Along Lake Louise Drive Throughout the Day, Summer 2025 - text version
| Two way traffic | Southbound traffic (towards Upper Lake Louise) | Northbound traffic (towards community) | |
|---|---|---|---|
| 1 AM | 10 | 5 | 5 |
| 2 AM | 6 | 3 | 3 |
| 3 AM | 7 | 5 | 2 |
| 4 AM | 29 | 26 | 3 |
| 5 AM | 55 | 50 | 5 |
| 6 AM | 128 | 117 | 12 |
| 7 AM | 203 | 136 | 67 |
| 8 AM | 263 | 144 | 119 |
| 9 AM | 481 | 246 | 235 |
| 10 AM | 481 | 246 | 235 |
| 11 AM | 596 | 295 | 301 |
| 12 PM | 677 | 338 | 338 |
| 1 PM | 732 | 361 | 371 |
| 2 PM | 740 | 367 | 373 |
| 3 PM | 744 | 364 | 380 |
| 4 PM | 727 | 351 | 376 |
| 5 PM | 705 | 339 | 367 |
| 6 PM | 615 | 288 | 327 |
| 7 PM | 534 | 248 | 286 |
| 8 PM | 463 | 212 | 251 |
| 9 PM | 302 | 114 | 188 |
| 10 PM | 145 | 47 | 97 |
| 11 PM | 48 | 21 | 27 |
| 12 AM | 21 | 10 | 11 |
During the 2025 shuttle season, visitor use began at the Lake Louise Park and Ride between 6 am and 7 am and declined after 8pm. This aligned with the seasonal overnight restrictions along Whitehorn Road. Mornings are the most popular times for shuttle departures so incoming traffic began to decrease around 2 pm.
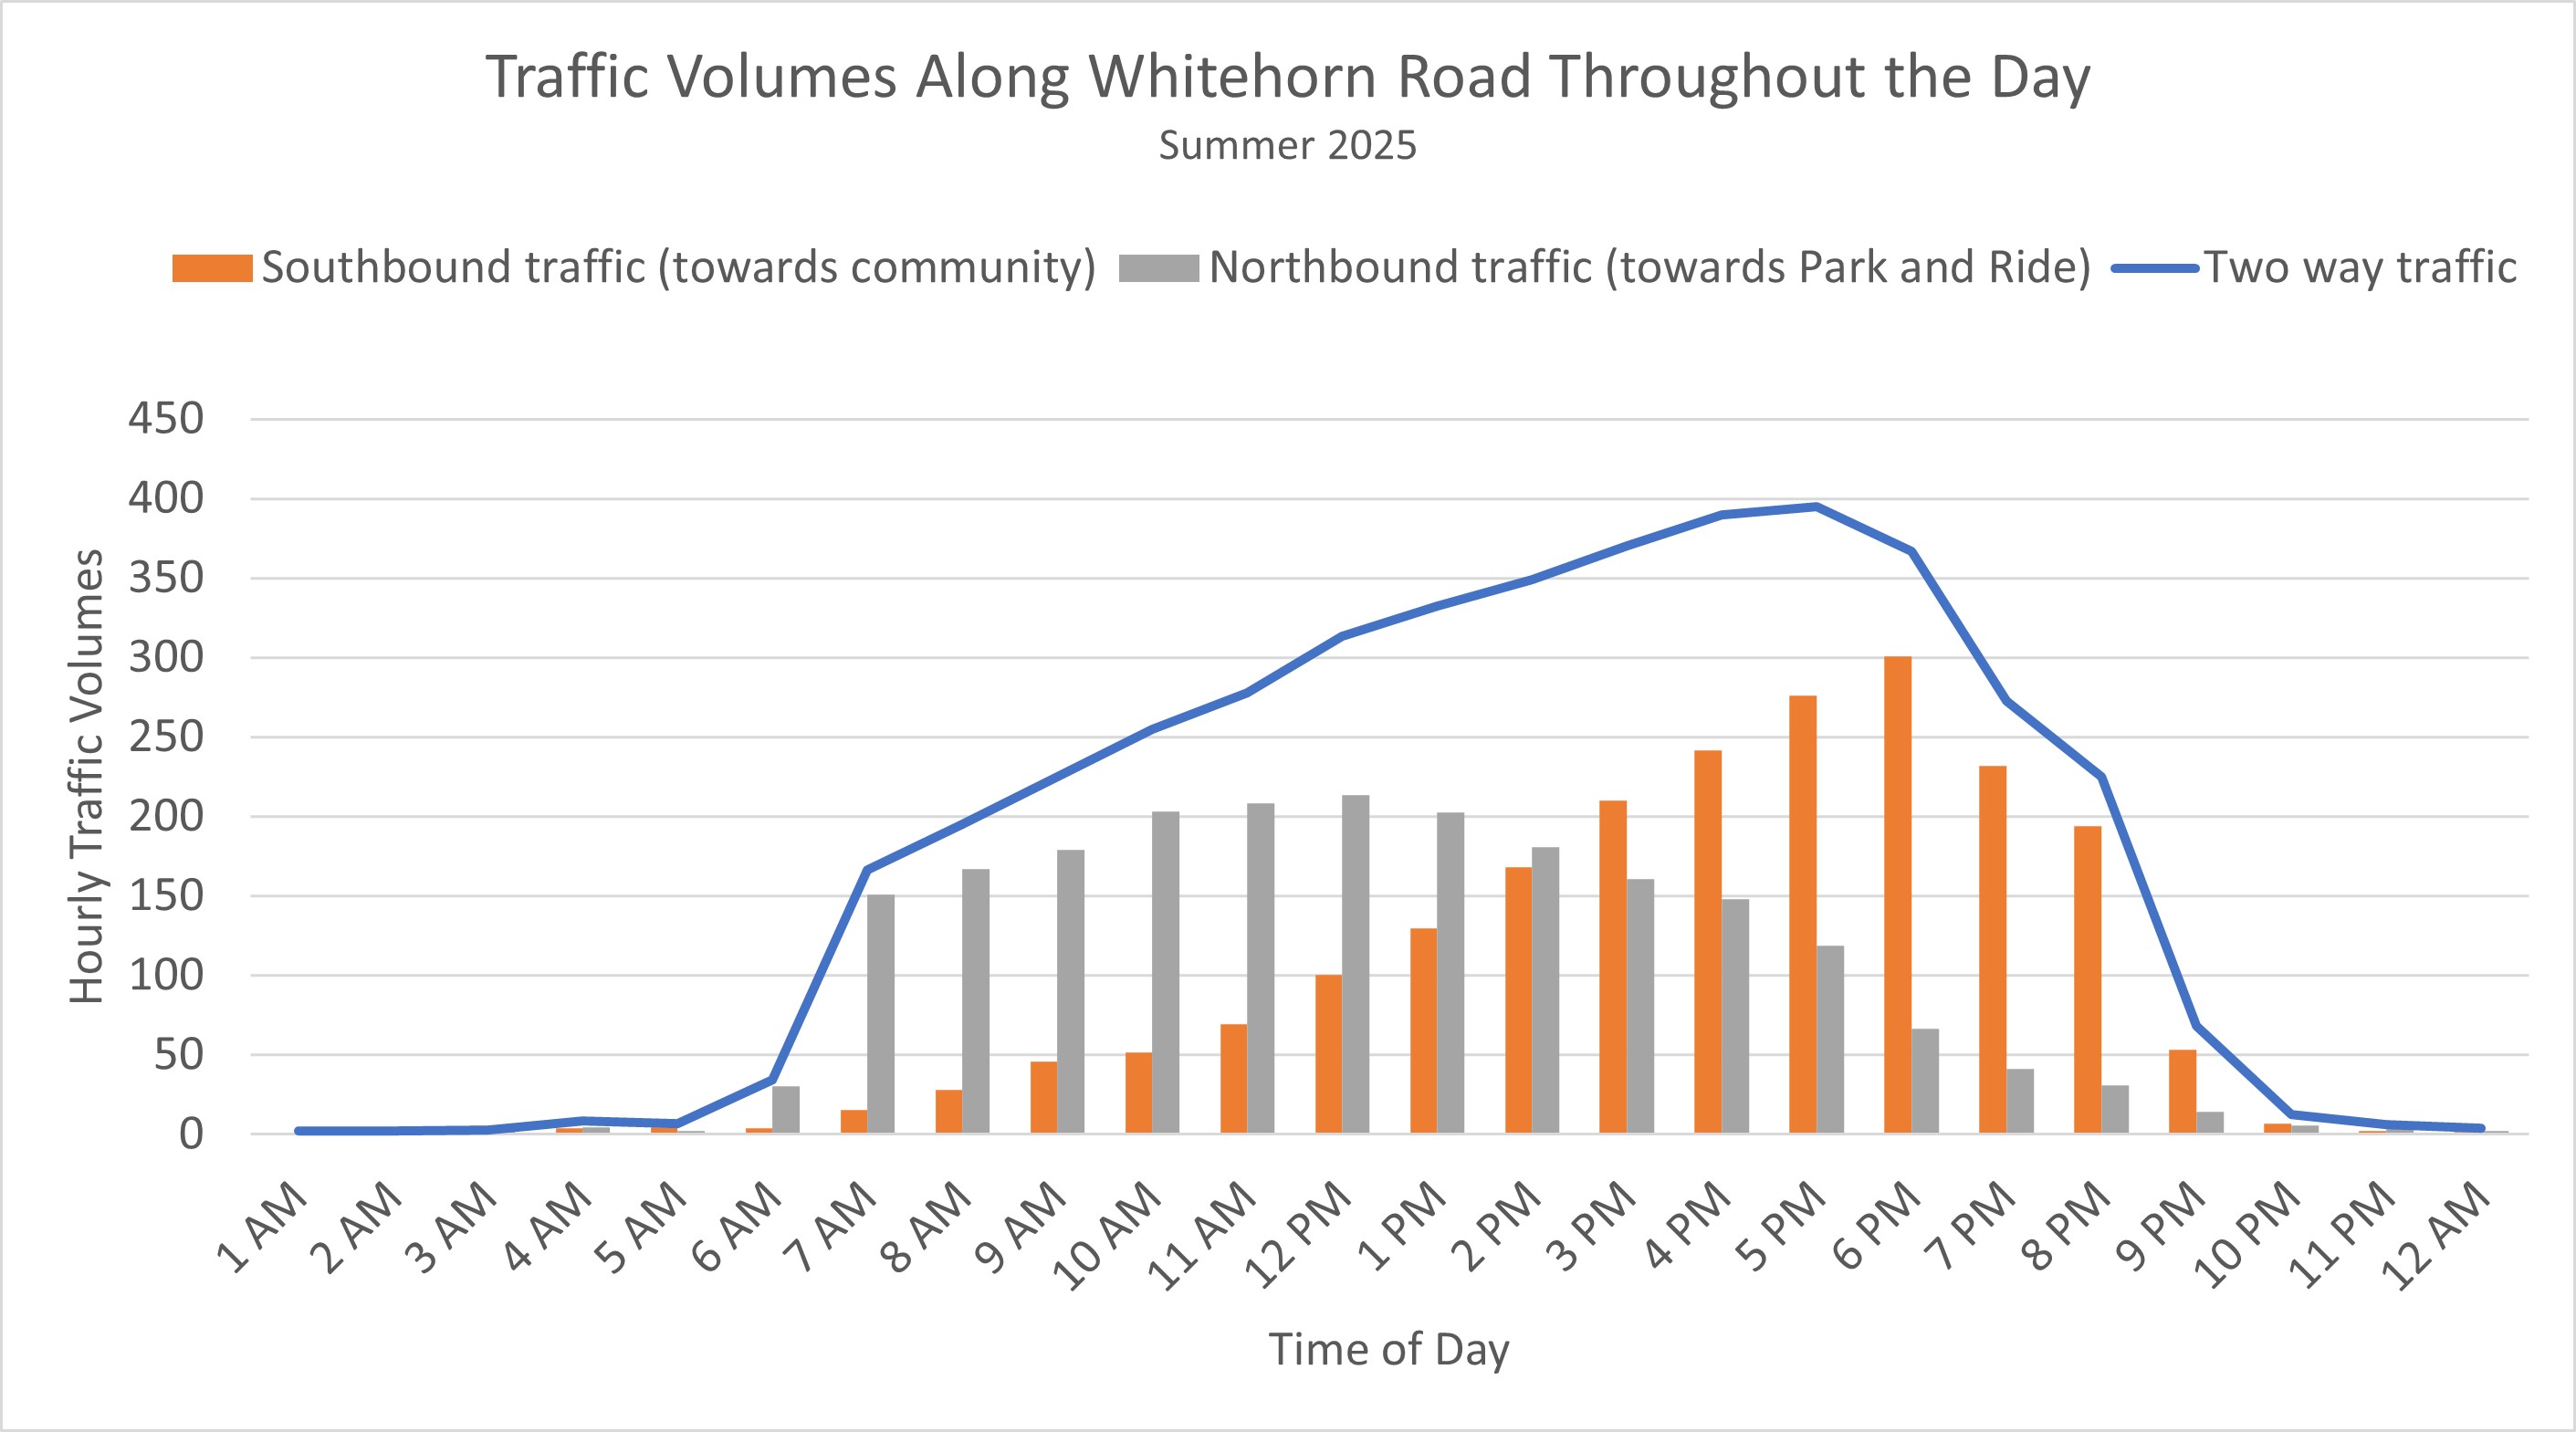
Traffic Volumes Along Whitehorn Road Throughout the Day, Summer 2025 - text version
| Two way traffic | Southbound traffic (towards community) | Northbound traffic (towards Park and Ride) | |
|---|---|---|---|
| 1 AM | 2 | 1 | 2 |
| 2 AM | 2 | 1 | 1 |
| 3 AM | 3 | 1 | 1 |
| 4 AM | 8 | 4 | 5 |
| 5 AM | 7 | 5 | 2 |
| 6 AM | 34 | 4 | 30 |
| 7 AM | 166 | 15 | 151 |
| 8 AM | 195 | 28 | 167 |
| 9 AM | 225 | 46 | 179 |
| 10 AM | 255 | 52 | 203 |
| 11 AM | 278 | 69 | 208 |
| 12 PM | 314 | 100 | 213 |
| 1 PM | 332 | 130 | 202 |
| 2 PM | 349 | 168 | 181 |
| 3 PM | 370 | 210 | 161 |
| 4 PM | 390 | 242 | 148 |
| 5 PM | 395 | 276 | 119 |
| 6 PM | 367 | 301 | 66 |
| 7 PM | 273 | 232 | 41 |
| 8 PM | 225 | 194 | 31 |
| 9 PM | 68 | 54 | 15 |
| 10 PM | 12 | 7 | 6 |
| 11 PM | 6 | 2 | 4 |
| 12 AM | 4 | 2 | 2 |
During the 2023 shuttle season, visitor use began in the Moraine Lake area around 5 am and lasted until 9 pm. Parks Canada shuttles began operating at 4 am and the last return shuttle was at 7:30 pm. There is a distinct user group arriving for sunrise and departing right after.
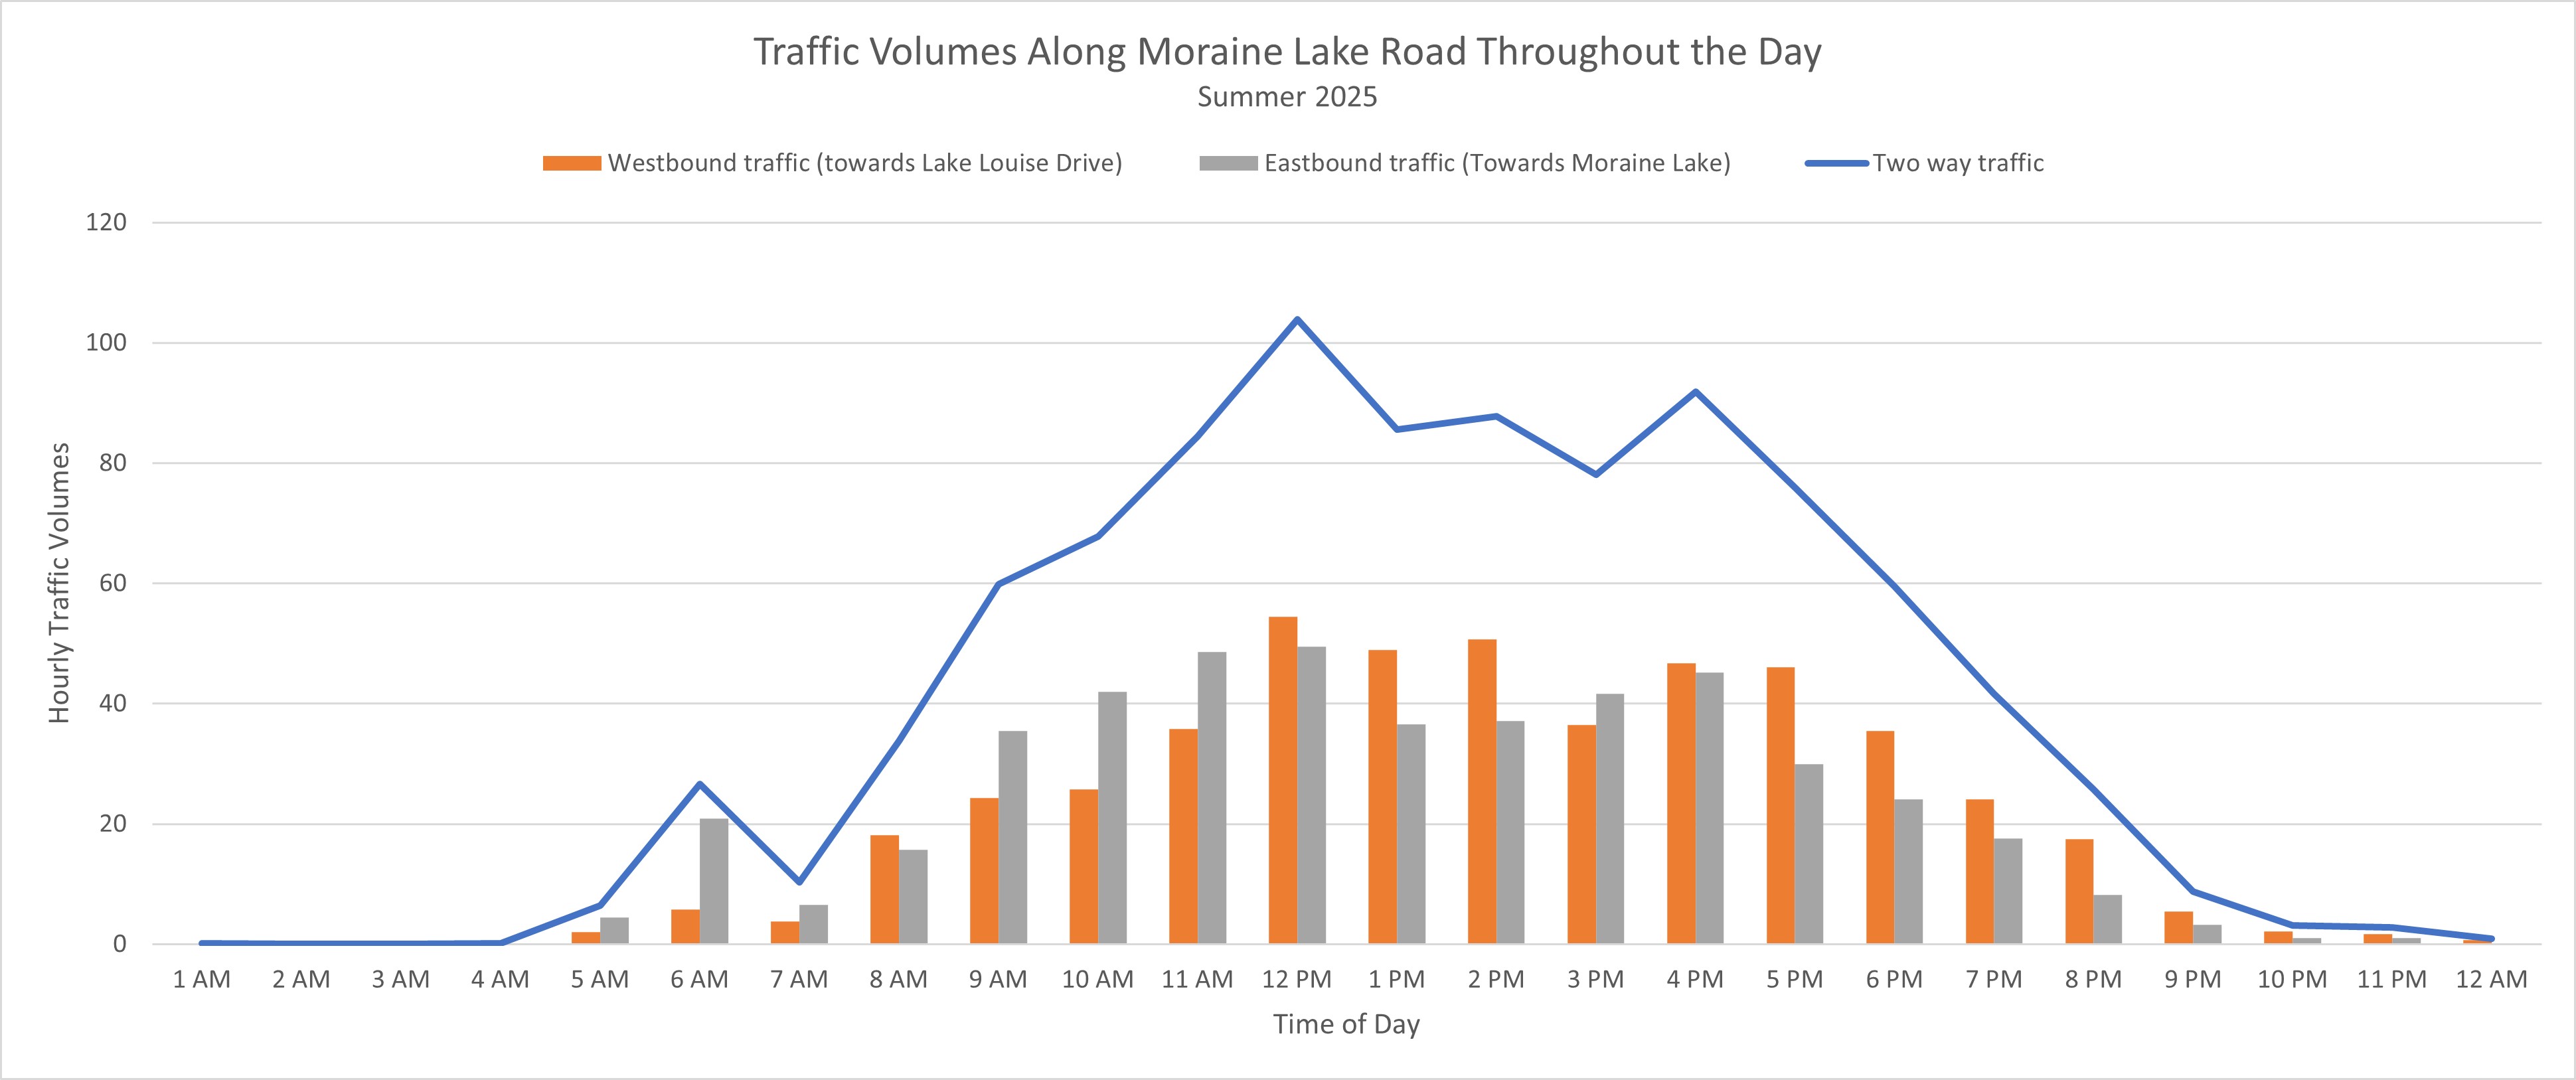
Traffic Volumes Along Moraine Lake Road Throughout the Day, Summer 2025 - text version
| Two way traffic | Westbound traffic (towards Lake Louise Drive) | Eastbound traffic (Towards Moraine Lake) | |
|---|---|---|---|
| 1 AM | 0 | 0 | 0 |
| 2 AM | 0 | 0 | 0 |
| 3 AM | 0 | 0 | 0 |
| 4 AM | 0 | 0 | 0 |
| 5 AM | 6 | 2 | 4 |
| 6 AM | 27 | 6 | 21 |
| 7 AM | 10 | 4 | 7 |
| 8 AM | 34 | 18 | 16 |
| 9 AM | 60 | 24 | 36 |
| 10 AM | 68 | 26 | 42 |
| 11 AM | 84 | 36 | 49 |
| 12 PM | 104 | 54 | 49 |
| 1 PM | 86 | 49 | 37 |
| 2 PM | 88 | 51 | 37 |
| 3 PM | 78 | 36 | 42 |
| 4 PM | 92 | 47 | 45 |
| 5 PM | 76 | 46 | 30 |
| 6 PM | 60 | 35 | 24 |
| 7 PM | 42 | 24 | 18 |
| 8 PM | 26 | 17 | 8 |
| 9 PM | 9 | 5 | 3 |
| 10 PM | 3 | 2 | 1 |
| 11 PM | 3 | 2 | 1 |
| 12 AM | 1 | 1 | 0 |
Over the years
Timing of visitation has shifted earlier in the day over the years, shown in traffic volumes and trail counter data. In certain places, such as Whitehorn Road, Parks Canada manages the timing of use with overnight restrictions to ensure a quiet period for wildlife. The shift in visitation to the dawn and pre-dawn hours at Moraine Lake was one of the reasons why personal vehicles were restricted on Moraine Lake Road in 2023.
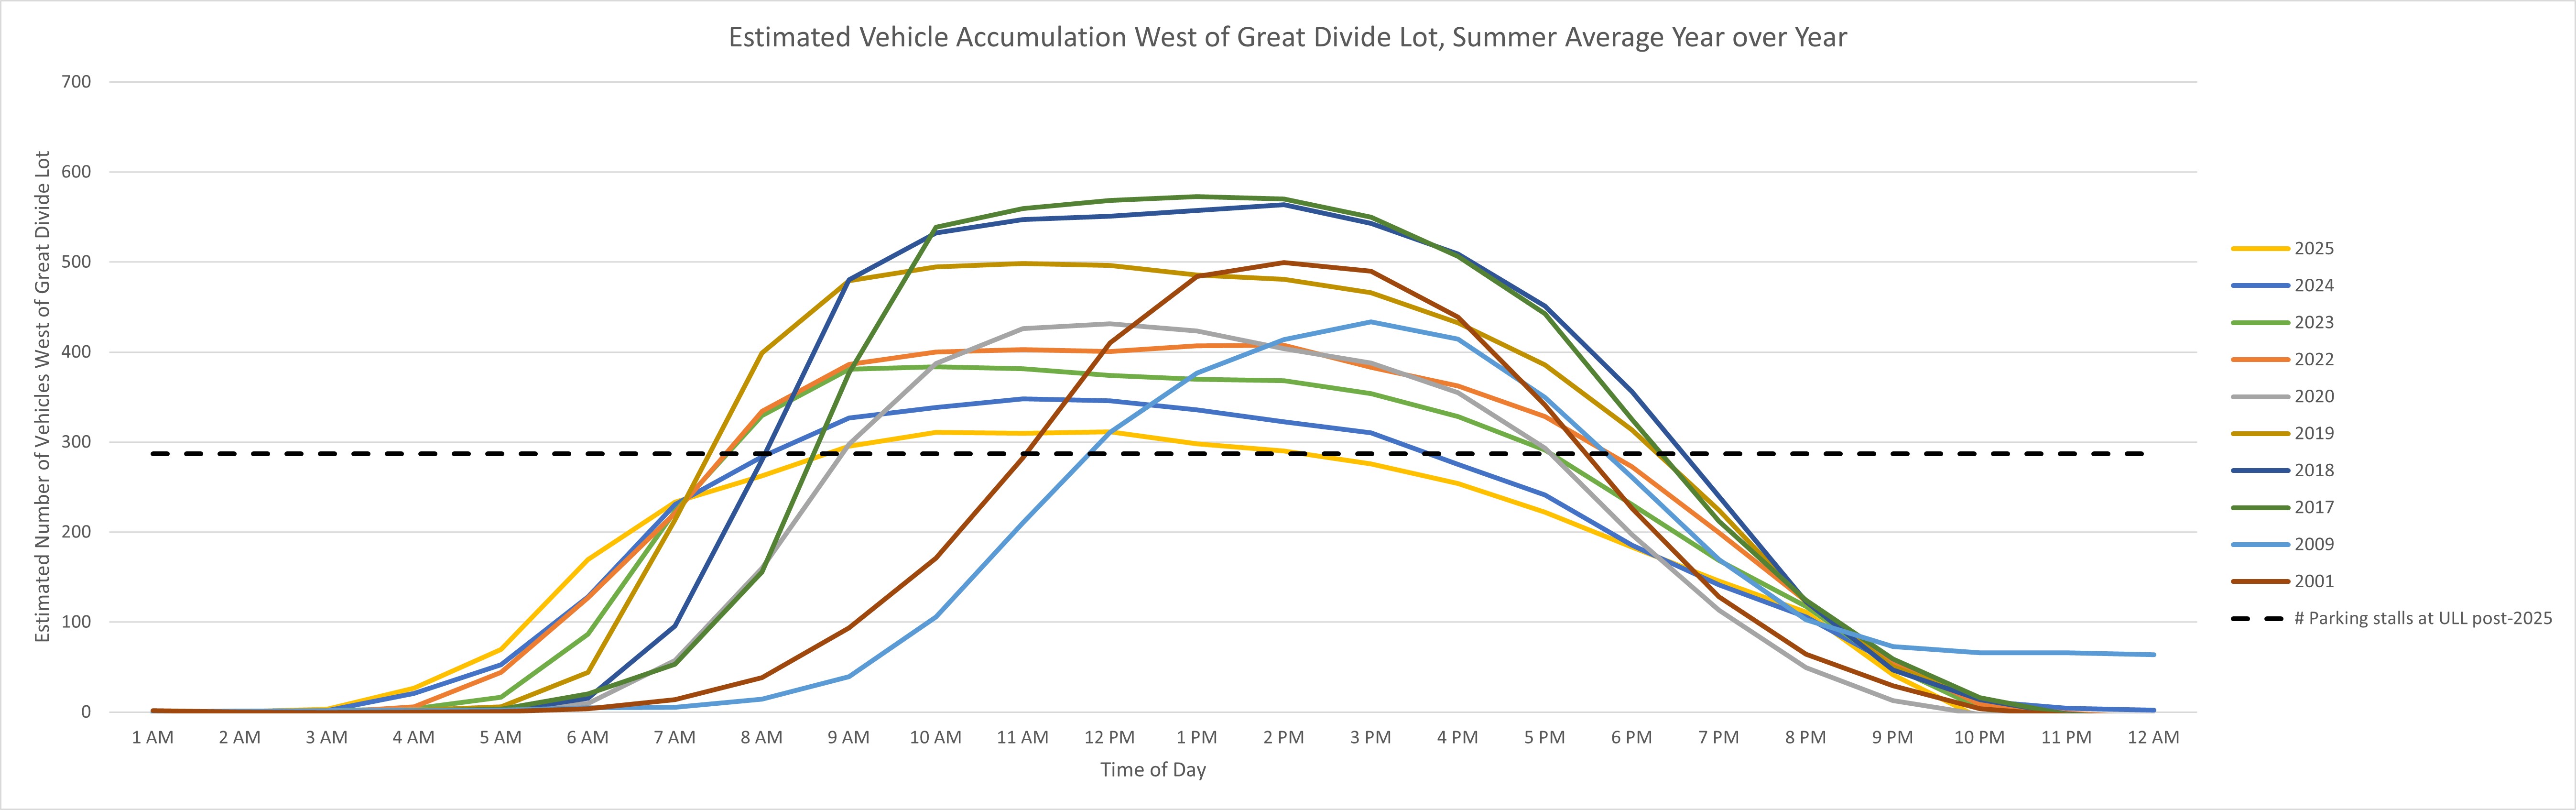
The graph below displays estimated vehicle accumulation throughout the day, year over year, in the Upper Lake Louise area. Vehicles redirected away when the parking lot is full do not count toward overall accumulations. Traffic volumes in the Upper Lake Louise area have shifted earlier in the day as the years have gone on. The parking lot is filling earlier than in prior years.
Estimated Vehicle Accumulation West of Great Divide Lot, Summer Average Year over Year - text version
| 1 AM | 2 AM | 3 AM | 4 AM | 5 AM | 6 AM | 7 AM | 8 AM | 9 AM | 10 AM | 11 AM | 12 PM | 1 PM | 2 PM | 3 PM | 4 PM | 5 PM | 6 PM | 7 PM | 8 PM | 9 PM | 10 PM | 11 PM | 12 AM | |
|---|---|---|---|---|---|---|---|---|---|---|---|---|---|---|---|---|---|---|---|---|---|---|---|---|
| 2025 | 0 | 0 | 3 | 26 | 69 | 170 | 233 | 263 | 295 | 311 | 310 | 311 | 298 | 290 | 276 | 254 | 222 | 184 | 145 | 111 | 41 | -6 | -21 | -21 |
| 2024 | 0 | 0 | 2 | 21 | 53 | 128 | 231 | 284 | 337 | 338 | 348 | 346 | 336 | 323 | 310 | 275 | 241 | 186 | 141 | 106 | 53 | 12 | 4 | 2 |
| 2023 | 0 | 1 | 2 | 4 | 17 | 87 | 223 | 329 | 381 | 384 | 382 | 374 | 370 | 368 | 354 | 328 | 291 | 230 | 168 | 117 | 50 | 4 | -10 | -15 |
| 2022 | -2 | -2 | 0 | 6 | 44 | 127 | 221 | 334 | 386 | 400 | 403 | 401 | 407 | 408 | 383 | 362 | 329 | 273 | 199 | 123 | 55 | 8 | -1 | -7 |
| 2020 | 1 | 1 | 2 | 3 | 4 | 10 | 57 | 160 | 298 | 387 | 426 | 431 | 423 | 404 | 388 | 355 | 293 | 197 | 113 | 49 | 13 | -3 | -3 | -3 |
| 2019 | 0 | 0 | 0 | 2 | 6 | 44 | 214 | 399 | 479 | 494 | 498 | 496 | 486 | 481 | 466 | 433 | 386 | 314 | 224 | 122 | 50 | 15 | -3 | -11 |
| 2018 | -1 | -1 | 0 | 0 | 1 | 16 | 96 | 280 | 480 | 532 | 547 | 551 | 557 | 564 | 543 | 509 | 451 | 356 | 240 | 123 | 47 | 14 | -2 | -8 |
| 2017 | 0 | 0 | 0 | 2 | 3 | 20 | 53 | 156 | 377 | 539 | 560 | 568 | 573 | 570 | 550 | 506 | 443 | 325 | 212 | 125 | 59 | 16 | -3 | -8 |
| 2009 | 0 | 1 | 2 | 2 | 2 | 5 | 5 | 14 | 39 | 106 | 210 | 311 | 377 | 414 | 434 | 414 | 349 | 261 | 170 | 103 | 73 | 66 | 66 | 64 |
| 2001 | 2 | 0 | 0 | 0 | 1 | 4 | 14 | 38 | 94 | 171 | 283 | 410 | 484 | 499 | 490 | 439 | 341 | 227 | 128 | 64 | 29 | 4 | -4 | -7 |
| # Parking stalls at ULL post-2025 | 287 | 287 | 287 | 287 | 287 | 287 | 287 | 287 | 287 | 287 | 287 | 287 | 287 | 287 | 287 | 287 | 287 | 287 | 287 | 287 | 287 | 287 | 287 | 287 |
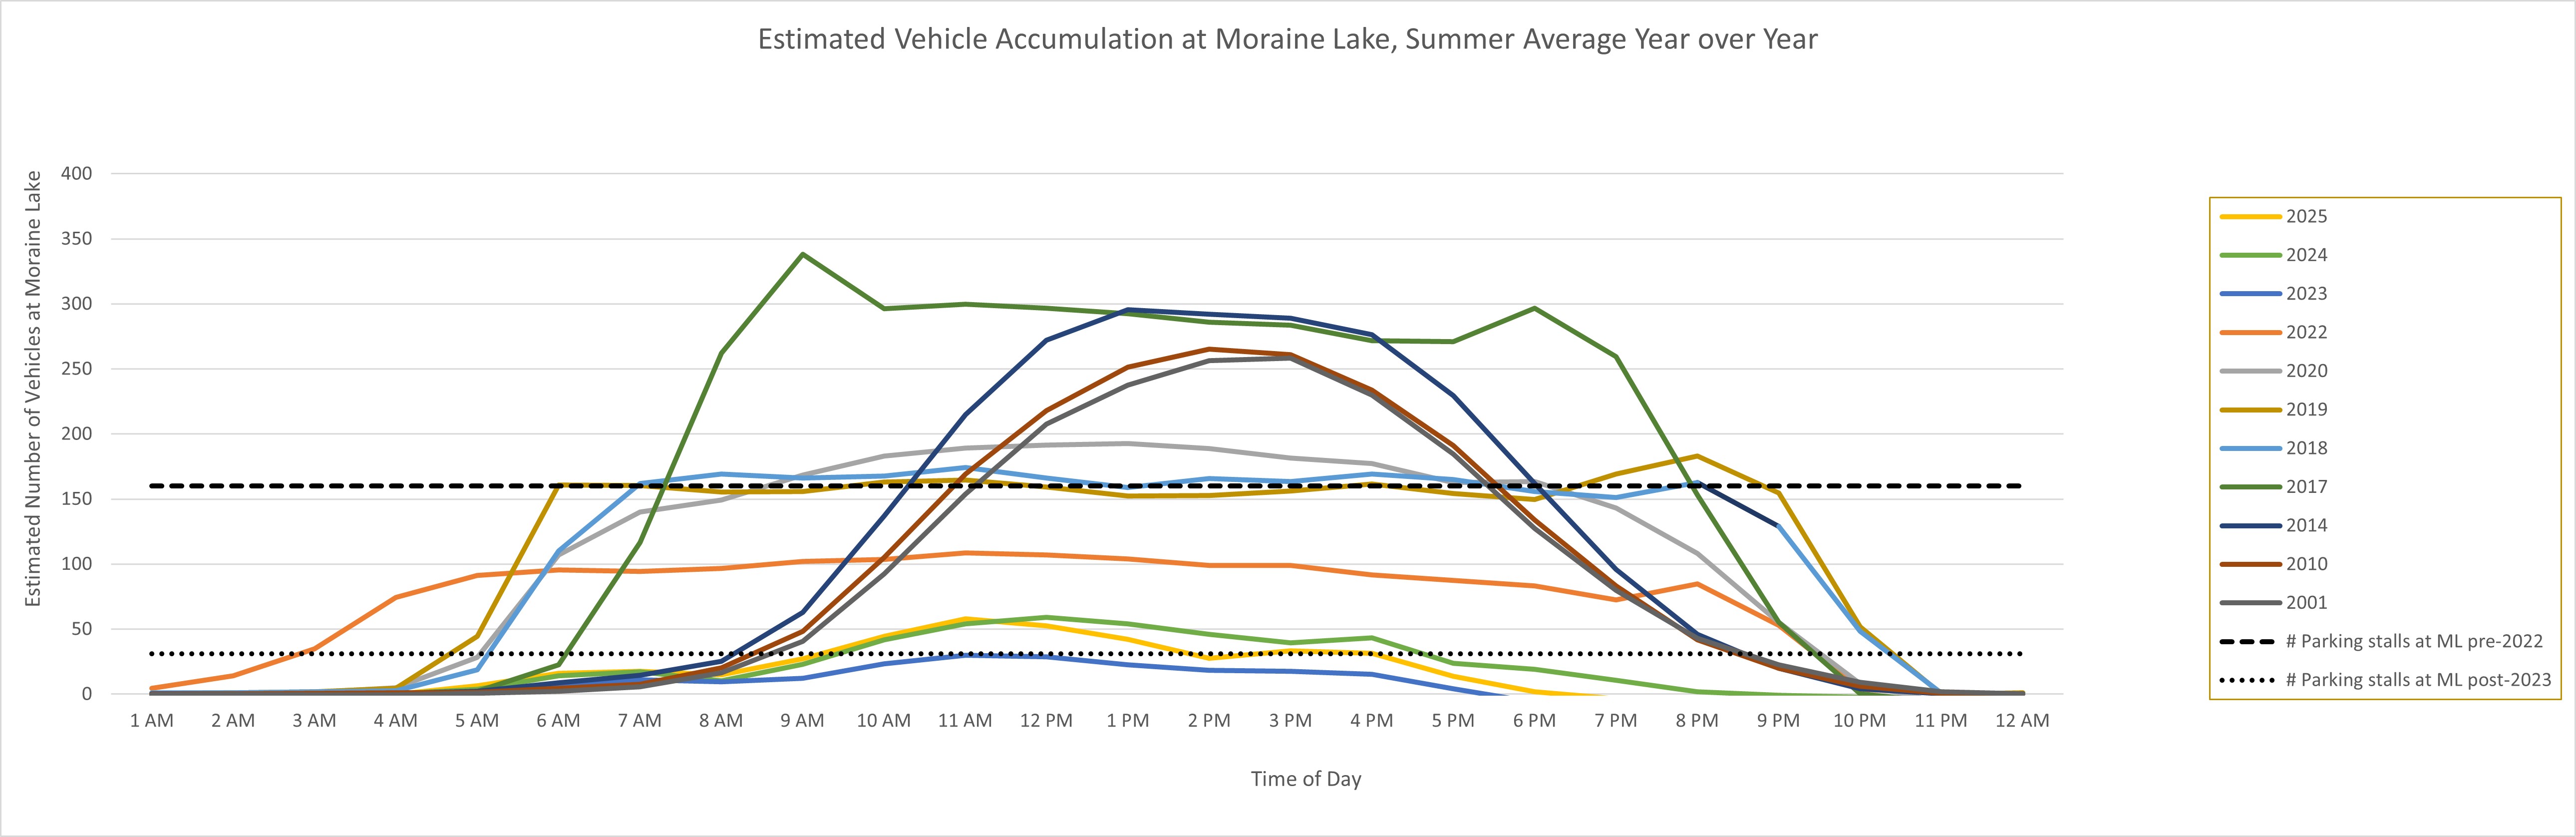
The graph below displays estimated vehicle accumulation throughout the day, year over year, in the Moraine Lake area. Traffic volumes in the Moraine Lake area have shifted earlier in the day over the years. In summer 2022, the parking lot was filling between 4 am and 5 am. In 2023, personal vehicles were restricted which led to the Moraine Lake parking lot operating at or below capacity with a move towards mass transit. In 2023, the parking lot was redesigned to accommodate larger occupancy vehicles like mini buses and motorcoaches as well as space for drop off and pick up. This was necessary to better accommodate the size and business models of various commercial vehicles.
Estimated Vehicle Accumulation at Moraine Lake, Summer Average Year over Year - text version
| 1 AM | 2 AM | 3 AM | 4 AM | 5 AM | 6 AM | 7 AM | 8 AM | 9 AM | 10 AM | 11 AM | 12 PM | 1 PM | 2 PM | 3 PM | 4 PM | 5 PM | 6 PM | 7 PM | 8 PM | 9 PM | 10 PM | 11 PM | 12 AM | |
|---|---|---|---|---|---|---|---|---|---|---|---|---|---|---|---|---|---|---|---|---|---|---|---|---|
| 2025 | 0 | 0 | 0 | 0 | 7 | 16 | 18 | 15 | 27 | 45 | 58 | 52 | 42 | 27 | 33 | 32 | 14 | 2 | -4 | -13 | -15 | -16 | -17 | -17 |
| 2024 | 0 | 0 | 0 | 0 | 4 | 14 | 17 | 10 | 23 | 42 | 54 | 59 | 54 | 46 | 40 | 43 | 24 | 19 | 11 | 2 | -1 | -3 | -4 | -3 |
| 2023 | 0 | 0 | 0 | 0 | 2 | 6 | 11 | 9 | 12 | 23 | 30 | 29 | 22 | 19 | 18 | 15 | 4 | -6 | -12 | -17 | -19 | -20 | -21 | -21 |
| 2022 | 4 | 14 | 35 | 74 | 91 | 95 | 94 | 97 | 102 | 103 | 109 | 107 | 104 | 99 | 99 | 92 | 87 | 83 | 73 | 85 | 53 | 4 | 1 | 1 |
| 2020 | 1 | 1 | 1 | 5 | 28 | 107 | 140 | 149 | 168 | 183 | 189 | 192 | 193 | 189 | 182 | 177 | 163 | 164 | 143 | 108 | 55 | 8 | -7 | -7 |
| 2019 | 1 | 1 | 2 | 5 | 44 | 161 | 160 | 155 | 156 | 163 | 165 | 159 | 152 | 153 | 156 | 161 | 154 | 150 | 169 | 183 | 154 | 52 | 0 | 1 |
| 2018 | 1 | 1 | 2 | 3 | 19 | 110 | 162 | 169 | 166 | 168 | 174 | 166 | 159 | 166 | 163 | 169 | 165 | 156 | 151 | 163 | 129 | 48 | 1 | 0 |
| 2017 | 0 | -1 | -1 | 0 | 2 | 22 | 116 | 262 | 338 | 296 | 300 | 297 | 292 | 286 | 284 | 272 | 271 | 297 | 259 | 153 | 55 | 0 | -6 | -6 |
| 2014 | 0 | 0 | 0 | 1 | 2 | 9 | 14 | 25 | 63 | 137 | 215 | 272 | 296 | 292 | 289 | 276 | 229 | 162 | 96 | 46 | 20 | 4 | 0 | 0 |
| 2010 | 0 | 0 | 1 | 1 | 2 | 5 | 8 | 20 | 48 | 105 | 169 | 218 | 251 | 265 | 261 | 234 | 191 | 134 | 83 | 42 | 20 | 6 | 1 | 0 |
| 2001 | 0 | 0 | 0 | 0 | 1 | 2 | 6 | 16 | 41 | 92 | 154 | 208 | 238 | 257 | 258 | 230 | 185 | 127 | 80 | 43 | 23 | 9 | 2 | 0 |
| # Parking stalls at ML pre-2022 | 160 | 160 | 160 | 160 | 160 | 160 | 160 | 160 | 160 | 160 | 160 | 160 | 160 | 160 | 160 | 160 | 160 | 160 | 160 | 160 | 160 | 160 | 160 | 160 |
| # Parking stalls at ML post-2022 | 31 | 31 | 31 | 31 | 31 | 31 | 31 | 31 | 31 | 31 | 31 | 31 | 31 | 31 | 31 | 31 | 31 | 31 | 31 | 31 | 31 | 31 | 31 | 31 |
Type of use
Recreation opportunities
Most people visit over the course of a single day. Multi-day trips though still make up a sizable portion of visitors in the Lake Louise area. These multi-day visitors include both frontcountry (residents, hotels, campground) and backcountry (Paradise Valley campground, Neil Colgan ACC Hut, or bivouacs).
Visitors come to the area to participate in many recreational activities between May and October. These include sightseeing, hiking, mountaineering, rock climbing, trail running, paddling, and cycling. Many commercial opportunities also exist. These include boat rentals, guided hikes and climbs, horse tours, and photography tours.
Age and group size
Although only a portion of visitors take the Parks Canada shuttle, it offers a representative snapshots of visitor ages and party size in the Lake Louise area. Shuttle reservations in 2023 consisted of 80 percent adults, 10 percent youth, 6 percent seniors and 4 percent children. The average number of people per group was three. This has not changed significantly.
Origin
Lake Louise remains a popular place with regional travellers, as well as international visitors. Parks Canada shuttle data is one of the best sources of visitor origin data for Lake Louise. Approximately 45 percent of shuttle riders in 2025 were from Canada, with two thirds of those from Alberta, British Columbia, or Ontario.
Most recent data suggests that 60% of visitors to Banff National Park are Canadian and of those 38% are from Alberta, BC and Saskatchewan.
- Date modified :